Curve Fitting 101 (Part 2)
Posted by Mark on November 8, 2019 at 06:04 | Last modified: April 18, 2020 10:30In the last post, I gave examples of how optimization could be used to manufacturer an investment newsletter scam. Today, I want to get back to trading system development and give another example of how curve fitting can generate deceptive results.
Also known as overfitting, curve fitting is tailoring a trading strategy to better match historical noise than persistent signal. The strategy may look great in backtesting, but it is unlikely to look good when applied to future data because noise is random.
Besides optimization (see Part 1), a second way to curve fit is to use specific parameter values. Consider a simple strategy that buys pullbacks (in TradeStation’s EasyLanguage):
If C = lowest(C,10) then buy next bar at market;
If barssinceentry >= 3 then sell next bar at market;
This strategy buys after the lowest close in 10 days (bars) and sells after the position has been open for at least three days.
Suppose this strategy suffered its maximum drawdown on the VIX spike over 35 in the 2008-9 financial crisis. Let’s add another rule by changing the first line to:
If C = lowest(C,10) and close of data2 < 35 then buy next bar at market;
Now, the long entry will occur when close is the lowest close in 10 days and when VIX is less than 35. This can improve the equity curve by avoiding a losing trade(s) and going flat in an area that previously experienced drawdown.
The problem here is adding a specific rule to fix a particular past occurrence. It’s like applying a single Band-Aid. A similar event capable of causing significant damage may occur in the future, but the filter may not be effective since we based it on a sample size of 1. Look what happened in February 2018:
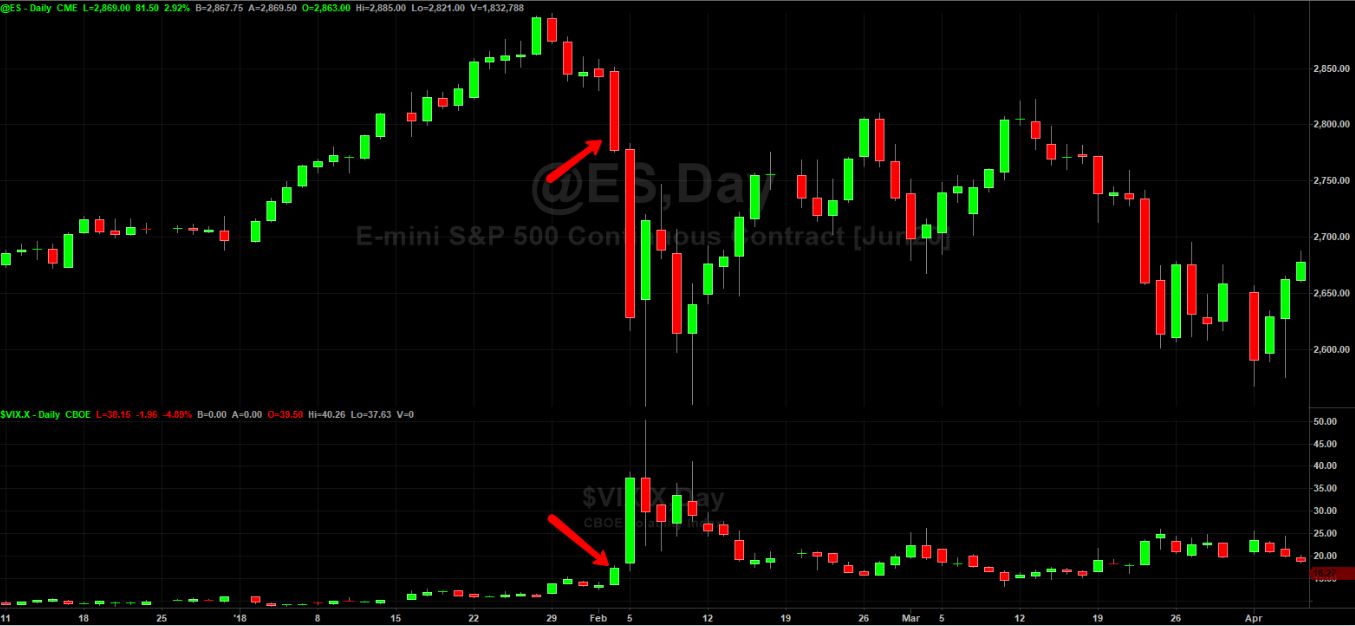
The arrows point to February 2 when ES had a big drop of 2.3% and VIX spiked to 17.31. That was a big move with VIX closing at its highest level in nearly 15 months (11/8/16), but it did not trigger our filter (17.31 < 35). The curve-fit strategy would enter the pullback just in time for February 5, 2018, when the market fell 5.4% and VIX spiked to 37.32. The VIX filter would now be active: one bar too late to serve its purpose. I analyzed a trading strategy that applied this rule here. My curve-fitting comments are in the seventh paragraph.
I will continue the discussion next time.