Curve Fitting 101 (Part 4)
Posted by Mark on November 14, 2019 at 12:14 | Last modified: April 20, 2020 10:56Before I move forward with trading system development approaches, I want to give one more example of how to curve fit: increasing strategy complexity.
Here’s a basic strategy (in EasyLanguage):
Input: len(14), //optimize 2-20 by 3
offset(40), //optimize 30-45 by 5
pt(500); //optimize 500-2000 by 500
setprofittarget(pt);
if percentR(len) < (50 - offset) then sellshort next bar at market;
if percentR(len) > (50 + offset) then buy next bar at market;
This is a trend-following strategy that will go long (short) when Williams %R is above (below) an extreme value. I am testing extreme %R values of 20 (80), 15 (85), 10 (90), and 5 (95):
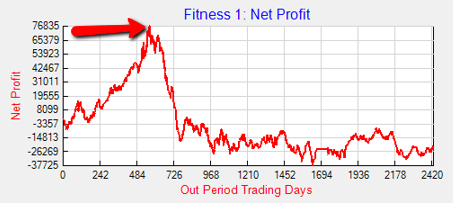
Notice how the strategy performed exceedingly well until the arrow (~500 days in). After that, equity took a precipitous fall and lingered in the doldrums for the remainder of the backtest.
I can improve this by increasing strategy complexity. At the arrow, I will flip from trend following to mean reversion:
if percentR(len) < (50 - offset) then buy next bar at market;
if percentR(len) > (50 + offset) then sellshort next bar at market;
After adding a rule, I can look at the equity curve again. Where I see the beginning of another large drawdown, I will add a subsequent rule to flip back to trend following. I can then look at the equity curve again. Where I see the beginning of another large drawdown, I will add a subsequent rule to flip to mean reversion. Rinse and repeat a few times!
With first four lines of code unchanged, here’s what I ended up with:
If date <= ELDate(11,01,2011) then begin
if percentR(len) < (50 - offset) then sellshort next bar at market;
if percentR(len) > (50 + offset) then buy next bar at market;
end;
If date > ELDate(11,01,2011) and date < ELDate(08,14,2012) then begin
if percentR(len) < (50 - offset) then buy next bar at market;
if percentR(len) > (50 + offset) then sellshort next bar at market;
end;
If date >= ELDate(08,14,2012) and date < ELDate(02,20,2013) then begin
if percentR(len) < (50 - offset) then sellshort next bar at market;
if percentR(len) > (50 + offset) then buy next bar at market;
end;
If date >= ELDate(02,20,2013) and date < ELDate(02,11,2014) then begin
if percentR(len) < (50 - offset) then buy next bar at market;
if percentR(len) > (50 + offset) then sellshort next bar at market;
end;
If date >= ELDate(02,11,2014) and date < ELDate(12,03,2015) then begin
if percentR(len) < (50 - offset) then sellshort next bar at market;
if percentR(len) > (50 + offset) then buy next bar at market;
end;
If date >= ELDate(12,03,2015) and date < ELDate(09,29,2016) then begin
if percentR(len) < (50 - offset) then buy next bar at market;
if percentR(len) > (50 + offset) then sellshort next bar at market;
end;
If date >= ELDate(09,29,2016) and date < ELDate(01,24,2018) then begin
if percentR(len) < (50 - offset) then sellshort next bar at market;
if percentR(len) > (50 + offset) then buy next bar at market;
end;
If date >= ELDate(01,24,2018) then begin
if percentR(len) < (50 - offset) then buy next bar at market;
if percentR(len) > (50 + offset) then sellshort next bar at market;
end;
I increased the number of rules in this strategy from one to eight. The rules couple date ranges with a mean-reversion/trend-following switch.
This is some of the most blatant curve-fitting possible. I’ve used nothing but hindsight, which we know is invalid as a system development technique (see fourth paragraph). Also, recall in Part 2 where I chose a specific parameter value (VIX < 35)? With that approach, I still have to settle for whatever equity curve results. Here, every rule I add directly manipulates the equity curve in whatever direction I so choose.
This is also the epitome of curve fitting because the rules refer to historical date ranges that don’t even exist in the future. Doing so is criminal indeed:
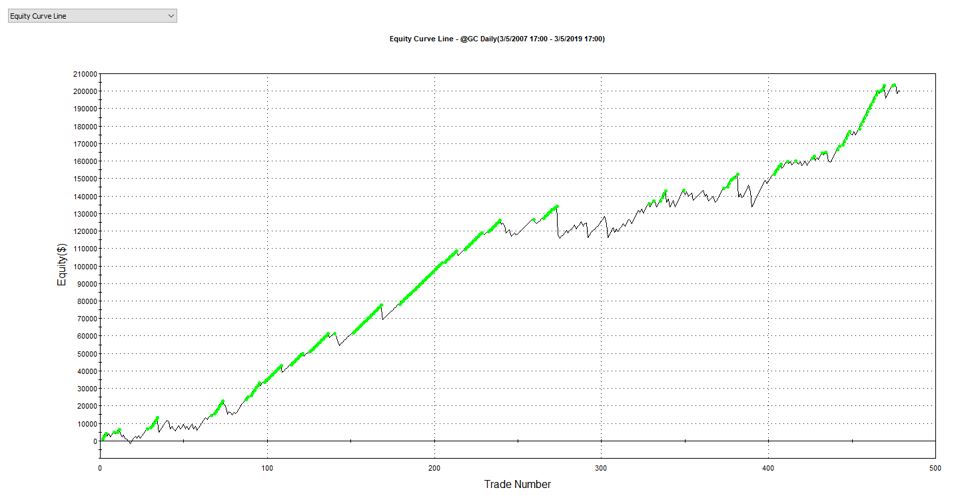
This has 78% winners on 479 trades, a profit factor of 1.71, and trades nearly even with regard to long and short positions (with short trade profit factor of 1.55). Slippage and commissions are included.
The more complicated the strategy, the more beautiful the equity curves. Just remember the more beautiful the equity curve, the less likely it is to be fit to signal rather than noise.
Today’s result is totally, utterly, and absolutely curve-fit. Can’t trade that, folks: no way, no how.