Bullish Iron Butterflies (Part 5)
Posted by Mark on September 5, 2017 at 06:45 | Last modified: June 1, 2017 14:07Today I want to focus on implied volatility (IV) to better understand whether high IV offers any edge to trading the BIBF.
I sorted the spreadsheet by Avg IV and tabulated counts and trade results:
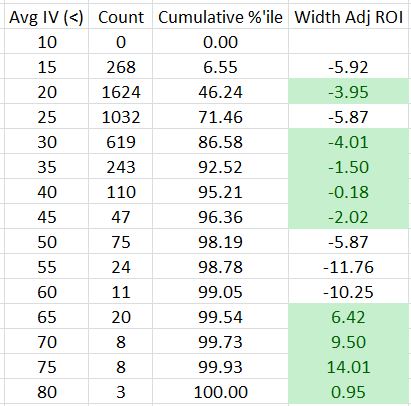
As expected, high IV does not occur very often: 71.46% of all trades occurred with IV under 25.
Higher IV does not seem to offer much of an edge. You may recall that the average width adjusted ROI across all trades is -4.22%. The green cells correspond to ROI numbers that are better than this and they appear scattered across IV categories.
The four exceptions are the profitable trades placed with Avg IV between 60-85.
Two things give me pause about drawing meaningful conclusions from these highest of IV levels. First, IV of 60 or greater encompasses only 0.95% of the total trades. Second, all these trades occurred between October 6 and December 12, 2008, which is a mere sliver of the 16+ years covered by the entire backtest. This short time interval also corresponds to just one market condition: the worst crash we have seen this century. I would not generalize based on such a limited sample size.
This illustrates one of the dangers of doing spreadsheet research. I put in formulas and whipped up these numbers but I still need to look over the computations and scrutinize whether they make practical sense. In this case, they appear meaningful even though they may be due solely to chance.
Besides comparing trades in different IV groupings, another approach is to take trades only when Avg IV equals an n-day high. This is similar to the metric of IV Rank, which is frequently discussed in trading circles. Here is the breakdown of trade performance when Avg IV hits an n (ranging from 5 to 90)-day high:
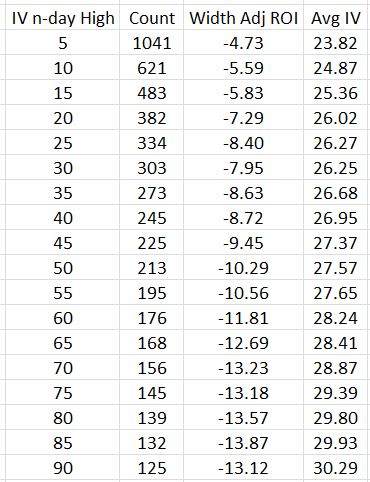
No groups show profitable average trades. I thought longer-term highs would correspond to higher IV levels, which would be more susceptible to mean-reversion thereby benefiting the BIBF. This may be happening along with big market moves at highest IV that offset the IV contraction (I have seen this before). I can tell that longer-term highs are selecting conditions with higher IV (including the most volatile IV spikes, which are probably included for most values of n) because IV is directly proportional to n.
To see such a strong inverse relationship between average trade and n, though, is quick shocking to this investigator.
Just in case you’re wondering why I’m bothering to analyze these data at all with them clearly amounting to a losing strategy, I remind you that the $26/contract transaction fee is having a significant negative effect on the results.