Bullish Iron Butterflies (Part 7)
Posted by Mark on September 13, 2017 at 06:20 | Last modified: June 7, 2017 13:31In need of a cure for these beautiful, sunny late-spring mornings? How about looking at maximum adverse excursion (MAE) distributions! Today I will proceed using the approach I described at the end of my last post.
What follows is a histogram of width-adjusted MAE. Total number of trades is plotted for every integer along the x-axis. Zero corresponds to the number of trades with width-adjusted MAE of zero. -1 on the x-axis corresponds to trades with width-adjusted MAE between 0 and -1%, -2 on the x-axis corresponds to trades with width-adjusted MAE smaller than -2% down to -1%, -15 corresponds to trades with width-adjusted MAE smaller than -15% down to -14%, etc.
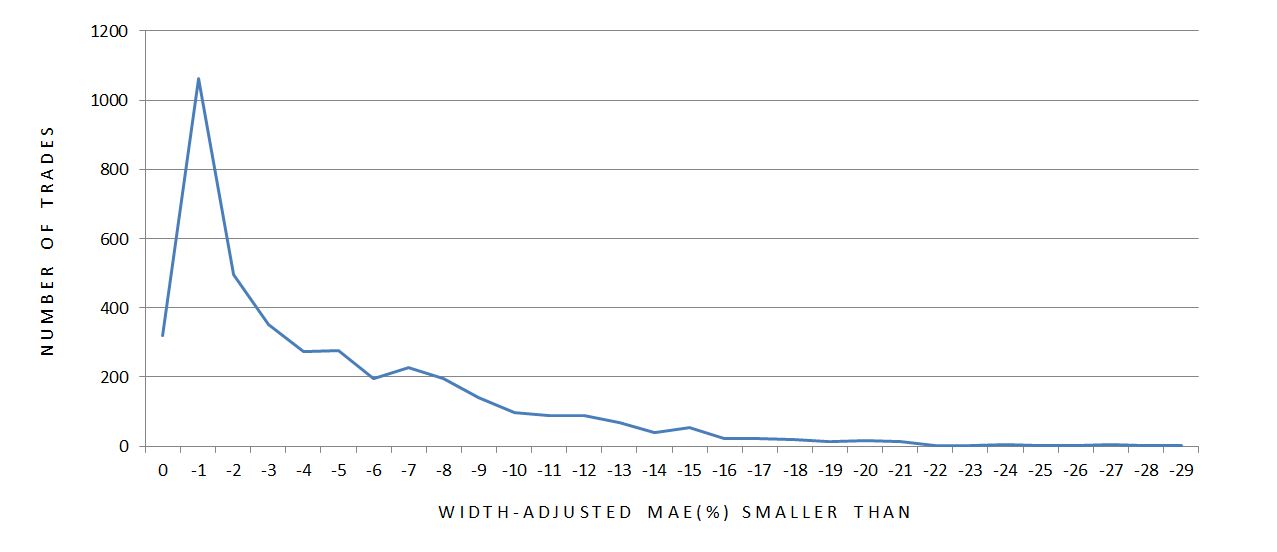
Some of the cumulative percentage numbers are worth noting here. 7.80% of all trades have zero MAE. 54.4% of all trades have MAE smaller than -3%. 88.8% and 99.2% of all trades have MAEs smaller than -10% and -20%, respectively.
The percentage of winning trades in each group can help determine whether MAE distribution may be effectively used to define a stop-loss. A clear argument for a stop-loss threshold would be a PnL value having all winning trades on one side and all losing trades on the other:
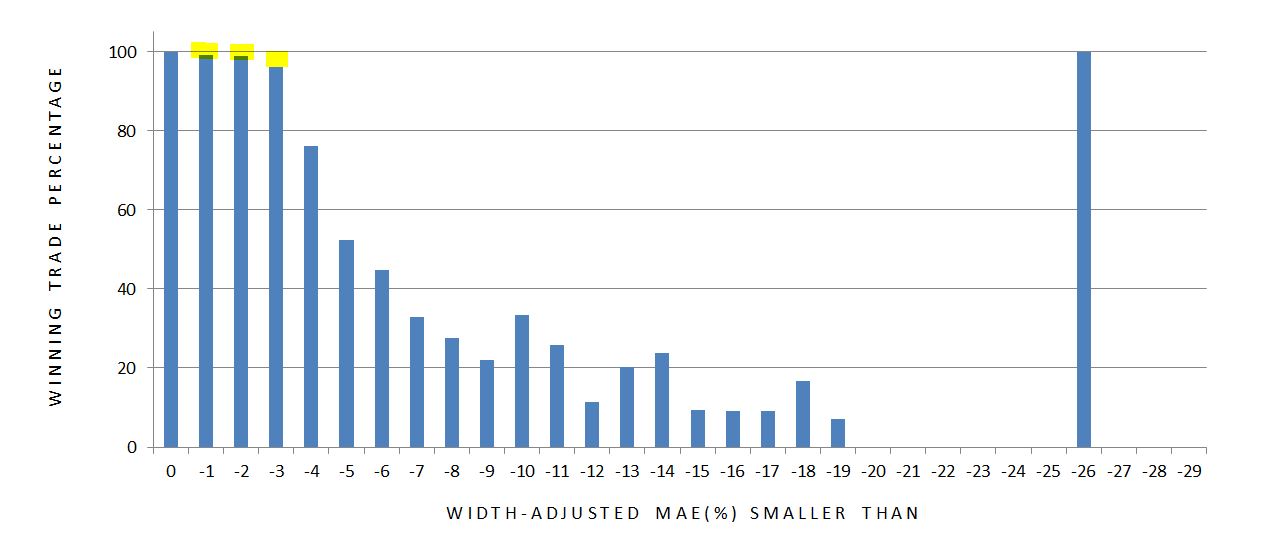
What surprised me was the presence of losing trades having such small MAEs (see yellow highlighting). Out of the 319 trades with zero MAE, 319 trades won: no surprise there. Out of the 1062, 495, and 351 trades with MAE smaller than -1%, -2%, and -3%, however, I had eight, six, and 14 losers, respectively. To be down so little during the lifetime of the trade yet not end up hitting the profit target is extremely unusual with the time-decay acceleration taking place into expiration.
A big market move on expiration Thursday could help to explain this. MAE includes PnL numbers from trade inception through 2 DTE while “expiration PnL” is tracked in another column. One reason I backtested this way was to identify big moves occurring late. I have strong suspicion of such a move wherever I have a maximum favorable excursion (MFE) occurring with < 7 DTE followed by a losing trade at expiration.
All of this is important because large losing trades in the face of small MAEs diminish the potential benefit of a stop-loss. One way to prevent this might be to exit all trades at 7 DTE and avoid expiration week altogether. This introduces “exit day” as another degree of freedom, though, which puts me at greater risk for the curse of dimensionality.
Before studying MFE and a date distribution for the losing trades described above, I see a bigger problem potentially lurking that should be addressed first.
I will talk about this next time.
Categories: Backtesting | Comments (0) | Permalink