Put Credit Spread Study 1 (Part 4)
Posted by Mark on October 30, 2017 at 07:38 | Last modified: August 14, 2017 13:58Today I will present data obtained from the methodology discussed here.
I started by adding $40 to each trade to represent the lower transaction fee. Going from $0.26/contract to $0.16 represents $10 per leg and the trade has two legs each to open and to close: 4 * $10 = $40.
I then recalculated and identified trades with ROI smaller than the -25% SL. I found 188 trades.
I then identified the original SL dates and looked at the chart to determine if these were bottoms. If so then I was probably looking at a flip. If not then I still had a loser and I would have to retest to see how big the loser would be.
This is when I realized that regardless of proposed alternatives, I would have to retest the 188 trades anyway. The previous step identified 40 trades as flip candidates. While that seemed encouraging, I only had part of the picture.
I proceeded to replace the original values of Exp ROI w/25% SL with 188 retested values. I then recalculated trade statistics.
Here are the results:
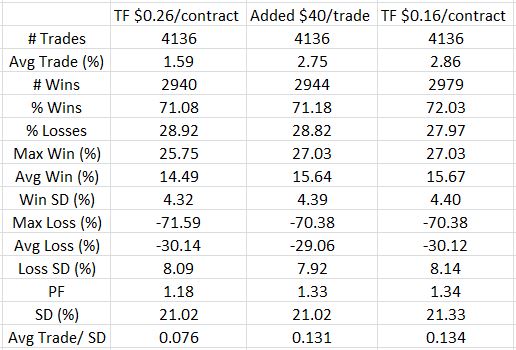
The third column is an approximation. While accounting for the lesser TF, it neither takes into account flips nor new PnL values for trades evading SL the original day only to trigger SL on a subsequent day.
To see the impact of lowering TF, therefore, the second and fourth columns should be compared. Doing so reveals an improvement in most of the statistics. I don’t see any surprises here. Simply adding $40 per trade is $40 / ($4000 – $40) = 1.01% on net margin. The average trade improved by 1.27%, which seems reasonable when flips are taken into account. Average loss remained about the same and 39 fewer trades actually lost with the lowered TF.
I think the moral of the story is that once again, execution makes a big difference. I am tempted to repeat the process for TF $0.06 but I think there may be cases where options priced $5.00 to $15.00 may incur more than nickel slippage. $0.16/contract may therefore be painting a realistic picture.
Another repetitive theme is the temptation to take only those trades that have gone against me by the slippage amount to improve the effective price. Profitable trades from inception throughout would go unable. Would this missed opportunity more than offset the benefit of improved entry price on all the others? That is the critical question.
Categories: Backtesting | Comments (0) | PermalinkUnresolved Quandaries (Part 3)
Posted by Mark on October 27, 2017 at 06:46 | Last modified: August 11, 2017 12:29Today I will finish mulling over ideas brought up during a 2016 conversation with my friend CJ.
At this point in my trading career, much of the discipline comes from engagement activities. I mentioned flexibility. That flexibility comes from my non-trading activities—questioned in the past because they seem optional or unnecessary. Although they do not translate directly to profits like clicking the execute button, they keep me on-track with related projects. Without this engagement I may lose interest in trading [new strategies]. Maintaining a high level of engagement requires commitment.
“Commitment” calls attention to the declining length of my workweek. The hardest part of my trading career was 2008-2011 when I spent 60+ hours/week to learn, to backtest, and to develop my strategy. Trading for others would represent a new business direction and a renewed sense of obligation to “recommit” by working more hours.
CJ and I eventually discussed management fee: another sticking point I must figure out before taking steps to manage other people’s money. How much I earn will determine whether my flexibility and spare-time sacrifices are worthwhile. The traditional hedge fund commission structure is a 2% management fee and 20% of the profits. I may or may not deserve to be in that category. The average adviser these days charges closer to 1% and with some “robo advisers” charging 0.5% or less, the average fee might be falling even further.
Suppose I charged 0.75%, which I think would be a tremendous bargain for someone in the “alternative investments” category. Raising $10M in assets (that’s a lot!) would amount to $75,000 gross revenue per year. I am uncertain whether net profit on that would cover my annual living expenses. Would this motivate me to sacrifice a flexible lifestyle?
In the beginning, I could charge a lower fee as enticement for people to give me a chance. One possibility would be to offer 0.75% (or free) with the expectation to increase fees over time as I prove my worth.
Perhaps the target fee structure should be proportional to my Sharpe Ratio relative to the industry average.
Aside from fee structure, I also need to come up with a marketing plan. Advantages to my trading approach include a consistent lowering of cost basis, a margin of safety, and getting time on my side [not the case when owning stocks]. When I lose I can lose big, but most of my trades are winners. On average I do better than most stock indices with a lower variability of returns. This means less risk, which has value.
Aside from fee structure and marketing plan, other unresolved quandaries include what kind of business structure to create and how many [if] partners to take on.
Categories: About Me | Comments (1) | PermalinkUnresolved Quandaries (Part 2)
Posted by Mark on October 24, 2017 at 07:25 | Last modified: August 11, 2017 05:23Today I continue review of my 2016 conversation with CJ about transitioning into the investment adviser (IA) industry.
I agreed with her suggestion that most people might not be capable of trading for themselves and suggested most do not even have the motivation to outperform.
CJ agreed and said even if I could average 20% annually trading options as opposed to 10% with stocks, this would not make a marketable difference. Most people don’t have the financial literacy necessary to understand what a huge long-term difference this would make without being scared off by the specter of derivatives. Far less than that additional 10% per year is needed to motivate money managers and IARs (salespeople) because institutional money will gravitate like moths around a flame but an appreciation for options requires a higher level of understanding.
In addition to the financially literate that can calculate compounded returns and understand options, the value of outperformance might appeal to those with a more competitive drive. Beating the “benchmark” has always motivated me because it represents personal accomplishment. Many wealthy individuals also have high degrees of ambition as evidenced by the hard work getting them to where they are. They just don’t have any desire to [learn how to] manage their own wealth, which could go back to what CJ said about brushing teeth or what I previously wrote about doing a brake job.
My preference would be to trade for a handful of wealthy individuals rather than a multitude of people with less to invest. In trading options, I would want to give each account individualized attention like I do my own. To make it worth my while, I would need a sizable amount of assets to manage.
“People aren’t going to give you a whole lot of money since you are just starting out with no track record,” CJ said.
Another good point…
As my optimism dimmed, I started to reflect on some big lifestyle sacrifices I might have to make. With my current trading strategy I have great flexibility. I must check in with the market at the same time every day but I can do non-trading activities at my convenience. I can go shopping or to the gym during the business day. I can travel and work remotely. For better or for worse, in managing other people’s money I would feel obligated to have my finger on the pulse of the market all day long.
I am disciplined now by holding myself to a 30-40 hour weekly schedule but in managing money for others I would feel the obligation to be even more so.
Categories: About Me | Comments (1) | PermalinkUnresolved Quandaries (Part 1)
Posted by Mark on October 19, 2017 at 06:58 | Last modified: August 9, 2017 08:27On May 8, 2016, I met up with my friend CJ and got to talking about other trading-related activities I would like to be doing. I took notes and due to its continued relevance, I am now formalizing this as a complete blog post.
I told CJ that I had considered giving educational presentations in addition to managing money for others. I discussed what I might offer compared to other investment advisers (IA).
CJ felt that most IAs are glorified salespeople. “All they do is sell other people’s funds,” she said right up front. Her husband used to work for a hedge fund and she seemed to be more informed than most on the topic.
CJ next supported the idea that I might bring something different to the table. I come from a trading—not sales—background. This might give me an edge over most advisers who have little to no option trading experience [much less know how options actually work]. I blogged about this previously and concluded it may not actually be the case but she agreed emphatically even before I could offer any caveat. At the very least, her support affirms it to be a decent marketing claim.
I next discussed how I support self-directed investing because much advertised in the industry is not as it appears to be (discussed in my last post). Again, CJ quickly agreed. “Advisers are salespeople and they know nothing. My husband knows more than our adviser and has had to tell him from time to time to make certain changes in the account. They just care about selling their company’s funds.”
If only I could always be addressing an audience with buy-in before even saying a word!
“It’s more than just selling funds. I also think it’s a failure to offer options as part of the trading strategy.” Because long stock is speculative, I view most stocks and funds as having added risk.
CJ now fell off the bandwagon as she came face-to-face with a perceived complexity about derivatives themselves. “Teaching people about options would be very difficult. That could take a long time to understand and is probably something the average person wouldn’t have any interest in learning.”
I lost her further when I tried to explain how the average person might trade options on a casual basis. CJ described how tired she is when she comes home from her part-time job (full-time would be even worse); checking up on her investments is the last thing she would want to do.
“You could probably check the market just once per day,” I said.
“How many people are able to do anything every day? On some days I’m lucky if I can even remember to brush my teeth!”
I will continue next time.
Categories: About Me | Comments (0) | PermalinkPrerequisites for Trading as a Business
Posted by Mark on October 16, 2017 at 07:14 | Last modified: August 8, 2017 12:57Trading as a business means generating consistent profits to cover all living expenses. Usually this is a full-time, independent pursuit. While I don’t think advanced degrees are necessary, I can think of three prerequisites for a trading start-up.
First, some degree of math proficiency is necessary for this level of money management mastery. Arithmetic is most applicable in order to calculate profit targets, stop-loss levels, performance, buy/sell points, position sizing, etc. A more advanced math background can make some derivative concepts more intuitive because option pricing models are based on differential equations. This isn’t mandatory, though; one can trade without having any knowledge of option greeks at all.
The second prerequisite for trading as a business is a strong capacity for critical thinking. No industry may be more littered with fraudulent pitches, false marketing/advertising claims, and overall chicanery than finance. I have written about this subject extensively (e.g. here, here, here, and here). In designing a business plan and sticking to it one must avoid being derailed into the quicksand. A background in statistics is a good defensive arrow to have in the quiver. Statistics provides a solid foundation from which to put questionable performance claims into reasonable perspective.
Critical thinking defends against the death knell that is being defrauded and suffering losses. Even greater than the financial losses may be the psychological damage in terms of trust, confidence, and safety: three key components to a fledgling business effort. I have spoken with a handful of people who have been violated by shady advisers. Once (if) they got out they never wanted (or couldn’t afford) to invest again (also reminiscent of catastrophic loss). I strongly suggest avoiding any black box system or advertisements of unrealistic returns. Steer clear of advisers who charge too much or smooth talkers who seem like they may have cut their teeth selling used cars. These last two sentences deserve separate blog posts of their own.
Finally, trading as a business requires money! Start-up capital is a safety cushion because like many other businesses, beginning traders often lose money (early success may actually be a curse leading to false confidence and a subsequent failure to adequately assess risk). Without this cushion, the stress of being forced to profit to stay afloat with bill payments can make long-term survival difficult. As the learning curve is scaled, magnitude of living expenses will dictate how large the trading account must be. A six-figure trading account might be necessary to cover the house, credit card, and insurance payments without taking on risk so great that Ruin is likely.
Categories: Option Trading | Comments (1) | PermalinkManaging Winners (Part 2)
Posted by Mark on October 13, 2017 at 06:19 | Last modified: August 4, 2017 11:47Today I want to conclude my discussion on managing winners.
I can imagine something like the following if I were to start managing winners. Placing trades daily, I would see some days where number of open positions would decline precipitously. Over the next couple weeks I would build back toward a maximum number unless other positions had been managed in the interim. The big losers would be unaffected. Smaller losers would have a better chance at being flipped because they may at some point hit the profit target (think probability of touching). Management of winners (e.g. at 50% max potential profit) means the average win would be smaller.
Taken together, persistent big losers, higher win rate, significantly smaller average win, and equal number of trades all strikes me as a recipe for disaster.
One thing I observe in daily trading without managing winners is a mix of “in-play” and “out-of-play” positions. Recently placed trades are in-play with responsive position greeks. Older trades often carry unrealized gains approximating max potential profit. Even big market moves are unlikely to affect these older, “out-of-play” positions due to negligible, unresponsive deltas, gammas, and thetas. With the exception of MR, the total portfolio acts as if these out-of-play positions were already closed.
Reflecting on these observations makes me thankful the market hasn’t made any large, adverse moves as of late. Such moves tend to increase the number of positions in play up to 100% (managing losers—perhaps with a SL—can decrease total number). I am grateful for the trading experience that allows me to make and analyze these observations because at some point, volatility will return in a big way marking the return of stressful nights [hopefully not for very long]. My goal is to factor all this into the trading system development.
Reflecting on these observations also makes me think that carrying some out-of-play trades is part of the whole design (i.e. perpetual scaling and time diversification). I could close out-of-play positions to cut risk, though. Indeed, I strongly suggest other option traders “do the right thing” and adhere to such a guideline. In effect, closing out-of-play trades is managing winners albeit much less aggressively (e.g. 80%-90% max potential profit as opposed to 50%). The impact on performance metrics is therefore going to be different than that profiled in many of the TT studies.
I will wrap this up with an empirical question for the future. As a more conservative way to manage winners, exiting out-of-play positions may also be conceptualized as buying back-end insurance. How does this compare, I wonder, to buying the insurance up-front in the form of being net long [DOTM] contracts or buying a small number of NTM hedges?
Categories: Option Trading | Comments (0) | PermalinkManaging Winners (Part 1)
Posted by Mark on October 10, 2017 at 06:55 | Last modified: August 4, 2017 08:27One direction I may or may not choose to explore at some point is that of managing winners. I have trouble wrapping my brain around this concept and today I will explain why.
Managing winners is a frequently discussed concept by the Tasty Trade (TT) folks but it certainly is not a new idea. In the past this has been described as a “yield grab” or “profit target.” Just like I might manage losers with a stop-loss order, I can manage winners based on a variety of criteria.
The TT philosophy is to manage winners, adjust (or not) losing trades if tested, and trade small. If a trade goes to max loss then I don’t get hurt because my position size is small. Some trades get down significant percentages but then recover to win, which is why they don’t advocate managing losses.
One of the problems I have with this approach is doubt over whether I can “trade small” and still make enough to pay the monthly bills. I could certainly do this with a multi-million dollar trading account. Few retail traders have this luxury, though. I see this as a big problem for anyone looking to trade full-time as a business but it probably doesn’t affect TT viewers very much if my lack of success in finding other full-time traders is any indication. “Trading small” suits part-time/hobby traders who don’t rely on trading profits to cover living expenses.
According to TT “research” (I use that term loosely for reasons discussed here), managing winners increases win rate, number of trades, and profit per day while decreasing standard deviation of returns. They generally conduct studies by comparing trades held to expiration with trades closed at a profit target. In both cases, a new trade is placed after the old trade is closed.
I have tailored my backtesting methods to avoid the pitfall of insufficient sample size by entering new trades every trading day. At some point I realized that as a perpetual scaling technique, this might be a viable approach to live trading. As long as I keep my daily position size small, the total position size may remain reasonable. This has been at the core of my NP research.
I believe it is through this looking glass that I get confused when contemplating management of winners. Managing winners allows for more frequent trade placement but I am already placing trades every day as part of my scaling effort. My number of positions is, in other words, already maxed out. Opening multiple new trades on a favorable market day that sees a number of winners managed (e.g. a big up day for NPs) would compromise my time diversification, which is not something I will pursue.
I will continue this discussion next time.
Categories: Option Trading | Comments (1) | PermalinkBacktesting Frustration (Part 8)
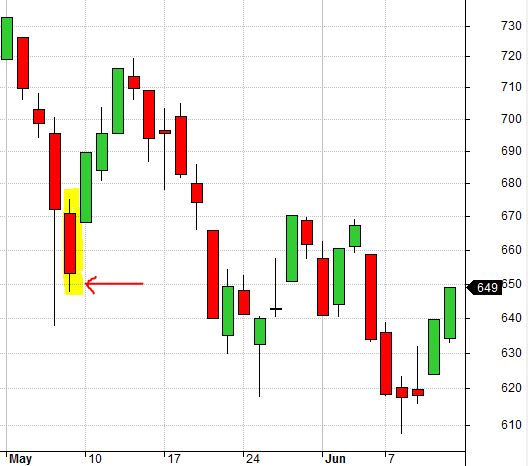
Posted by Mark on October 6, 2017 at 07:04 | Last modified: August 7, 2017 10:31Recall that my impetus for resurrecting this “Backtesting Frustration” blog series was the realization that I cannot use quick spreadsheet manipulations and calculations to reprocess 188 backtrades with lower transaction fees (TF). Today I want to go through a sampling of chart action showing different cases of false and real bottoms.
The highlighted candle below is a false bottom from 9/18/2001:
The SL would be triggered in subsequent days even if it was not triggered here due to lower TF.
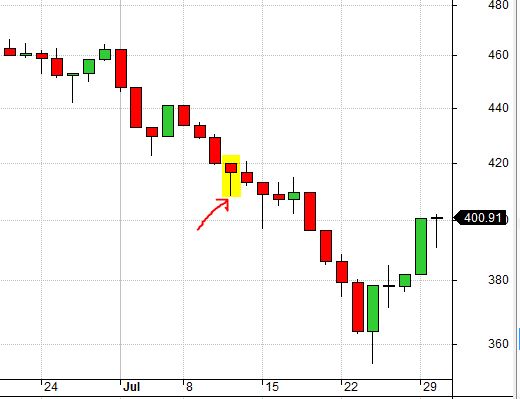
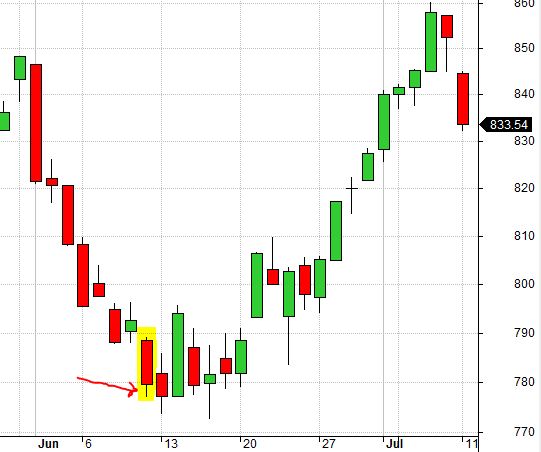
The highlighted candle below is a false bottom from 7/11/2002:
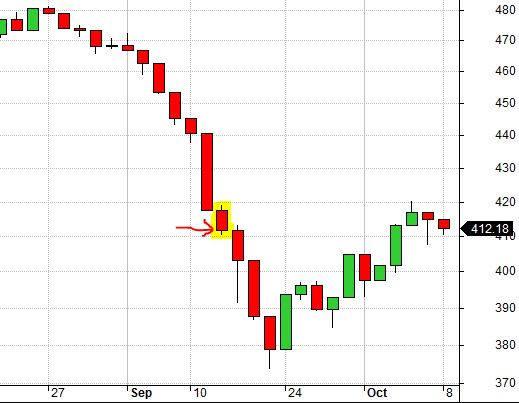
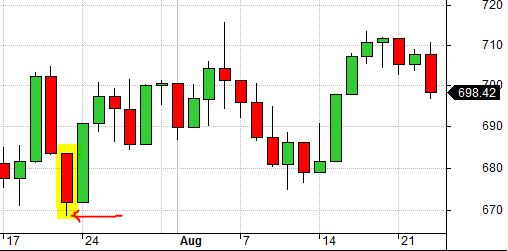
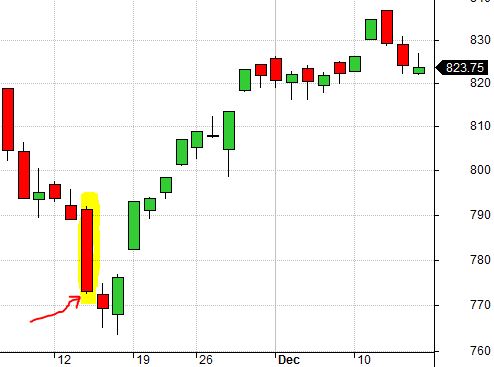
The highlighted candle below is a real bottom from 3/24/2004:
Because SL was not triggered two days earlier, this was the last downside move capable of taking the trade out at a loss. Smaller TF (slippage) would allow the position to evade SL and proceed to full profit.
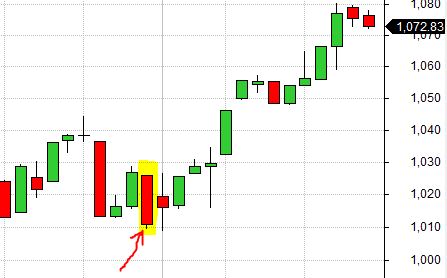
Here is another real bottom from 7/21/2006:
This is a false bottom from 3/1/2007:
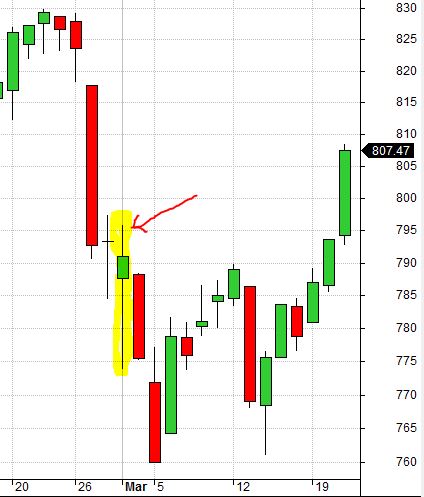
Because I backtest [once] daily, long wicks (as shown here) represent price extremes that may or may not force trade exit depending on what time intraday (see 5/6/2010 candle, below) they occur.
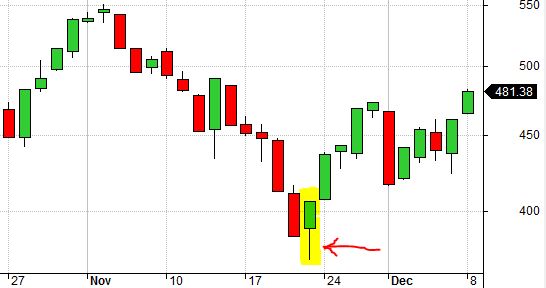
Here is a real bottom from 11/21/2008:
These are real bottoms from 2/4/2010 and 2/8/2010:
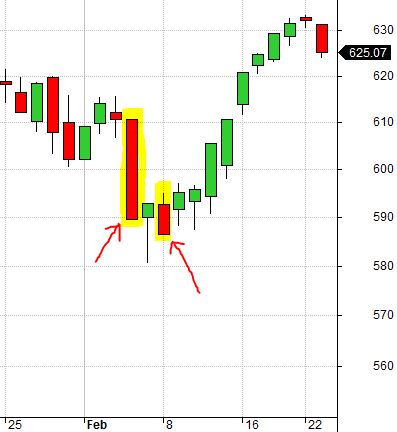
While the market went a few points lower on 2/8/2010, being close to February expiration allowed accelerated time decay to offset the move. Were this a March position, 2/4/2010 probably would have been a false bottom.
Here is a false bottom from 5/7/2010:
This would have been a real bottom for a May position but with the additional month to expiration, the market had time to recover and then fall once again.
Here is a false bottom from 6/10/2011:
Here is a false bottom from 11/14/2012:
Real bottom from 8/30/2013:
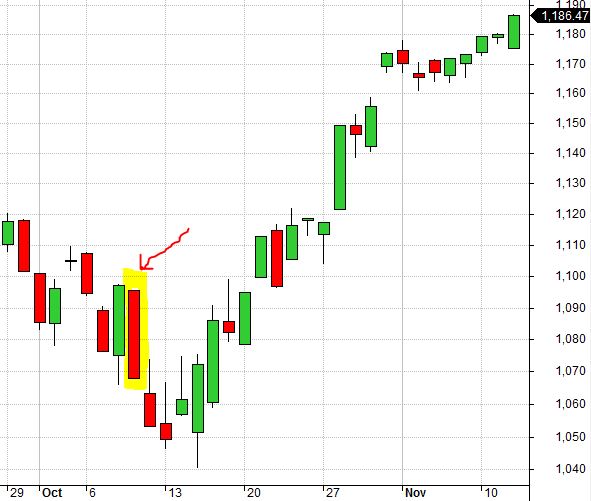
False bottom from 10/9/2014:
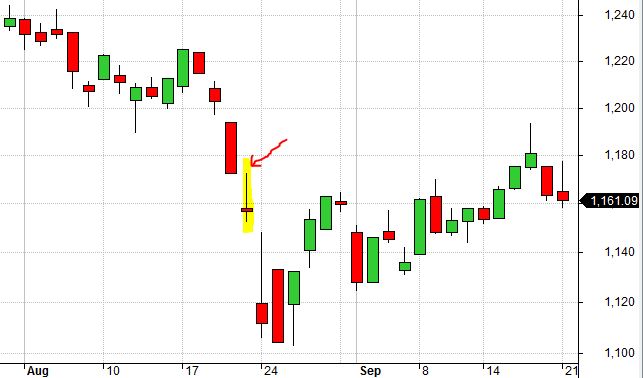
False bottom from 8/21/2015:
Here is a false bottom from 1/20/2016:
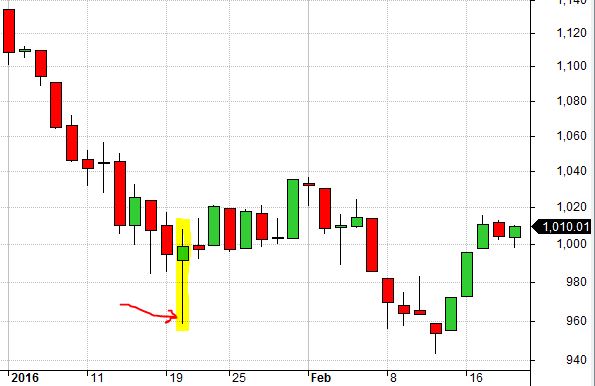
This is another big wick but a lot can happen with several weeks to expiration.
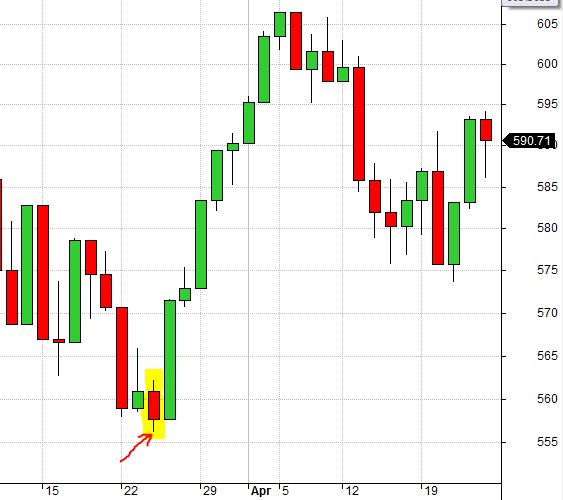
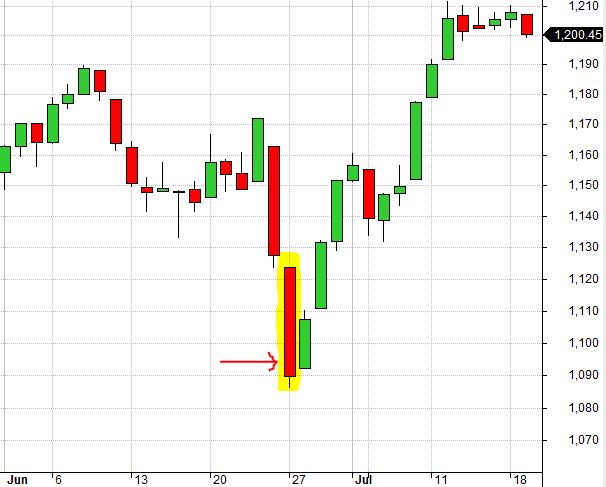
Finally, here is a real bottom from 6/27/2016:
While spreadsheets are great at managing large volumes of data and allowing us to do computational operations quite efficiently, we also have to be cognizant of what information they do not reveal. Besides outright fraud, I believe oversights like these are a major contributor to falsely optimistic backtesting results. This is a good reason why even advanced traders are best advised to undertake system development with others capable of proofreading the work.
Categories: Backtesting | Comments (0) | PermalinkBacktesting Frustration (Part 7)
Posted by Mark on October 3, 2017 at 06:35 | Last modified: August 2, 2017 13:18Today I resume my series on backtesting frustrations by talking about the frustration of “flips.”
I mentioned this in Part 1 with regard to recalculating results with different TF values. A trade that is down 25.5% with $0.26/contract may only be down 24.5% at TF $0.16/contract thereby evading the trigger of SL and ending up profitable. Simply recalculating the results, I thought, would overlook these flips (from loser to winner) altogether.
In taking a closer look at the put credit spread results I see that 188 out of 1,093 trades originally hitting the -25% SL show a loss smaller than -25% with $40/trade added.
I can now proceed in a few different ways: 1. Redo the 188 trades with TF $0.16 ($0.06)/contract; 2. Assume the SL was not hit and use either 7 DTE or Exp PnL values instead; 3. Assume these 188 trades closed for zero gain/loss.
Without doubt, the first option would be most accurate and also the most time-consuming.
I therefore started working with option #2 until I realized a major problem with the assumption. A trade that evades SL on one day may still hit SL on a subsequent day. Being so close to SL, another down day would probably trigger the unprofitable exit. With the market showing recent bearishness this seems quite feasible.
Furthermore, if the subsequent down day is big then the loss might end up being much greater than initially recorded.
Option #3 was intended to be a more conservative form of #2. In [falsely] thinking most of these trades avoiding SL would flip, it occurred to me that the market may not recover enough for full profit to be realized. To be conservative I could just call those zeros. Even a zero is much better than -25% for overall performance.
Hopefully I have made it clear that I can’t assume enough to go with option #2 or #3.
I then considered a fourth option: look at the chart. If the market is bottoming on the day the SL is hit then I can proceed per option #2 or #3 depending on where the market is at 7 DTE or Exp.
Still though, if the “Furthermore” (look up four paragraphs) happens then I may be looking at a much larger loss; just leaving it as before plus $40 would be inaccurate. This would be an argument for redoing all 188 trades. While it may not seem like lower TFs could translate to larger losses, there is a lack of granularity when testing on an EOD basis.
In stepping back and considering the wider perspective, it seems like a chance occurrence whether a flip or larger loss will occur. Unfortunately, I feel I must retest in order to have any possibility of knowing for sure.
Categories: Backtesting | Comments (2) | Permalink