Backtesting Frustration (Part 8)
Posted by Mark on October 6, 2017 at 07:04 | Last modified: August 7, 2017 10:31Recall that my impetus for resurrecting this “Backtesting Frustration” blog series was the realization that I cannot use quick spreadsheet manipulations and calculations to reprocess 188 backtrades with lower transaction fees (TF). Today I want to go through a sampling of chart action showing different cases of false and real bottoms.
The highlighted candle below is a false bottom from 9/18/2001:
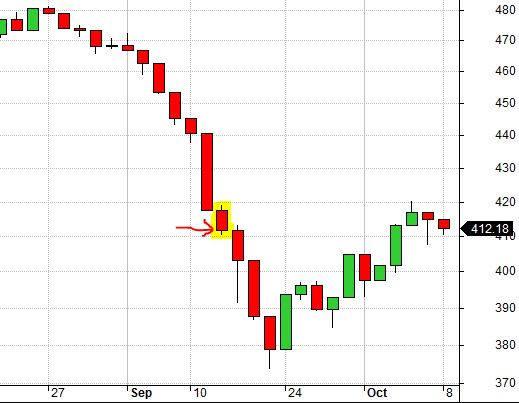
The SL would be triggered in subsequent days even if it was not triggered here due to lower TF.
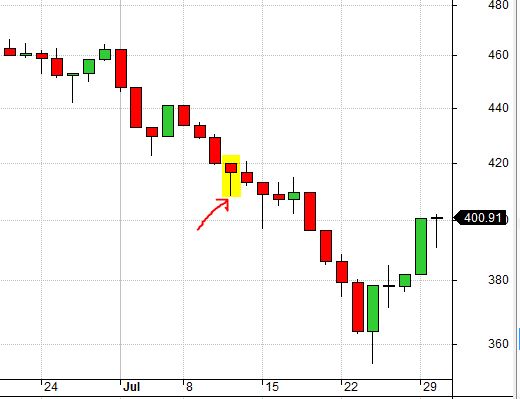
The highlighted candle below is a false bottom from 7/11/2002:
The highlighted candle below is a real bottom from 3/24/2004:
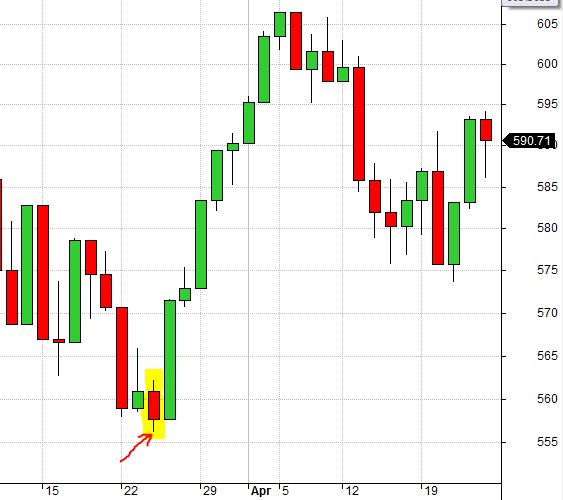
Because SL was not triggered two days earlier, this was the last downside move capable of taking the trade out at a loss. Smaller TF (slippage) would allow the position to evade SL and proceed to full profit.
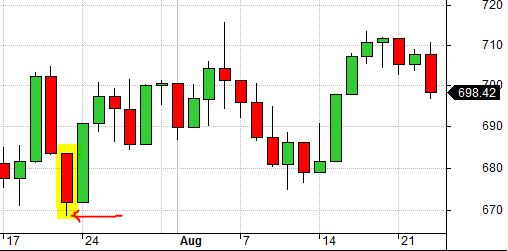
Here is another real bottom from 7/21/2006:
This is a false bottom from 3/1/2007:
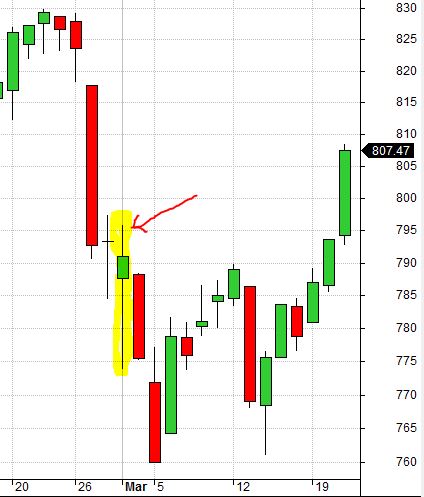
Because I backtest [once] daily, long wicks (as shown here) represent price extremes that may or may not force trade exit depending on what time intraday (see 5/6/2010 candle, below) they occur.
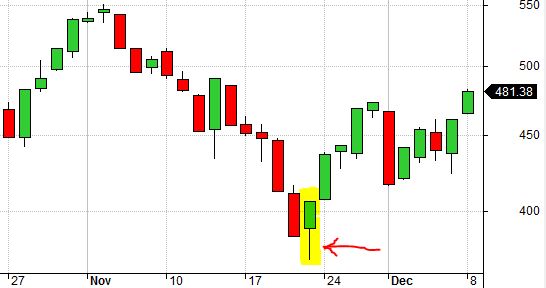
Here is a real bottom from 11/21/2008:
These are real bottoms from 2/4/2010 and 2/8/2010:
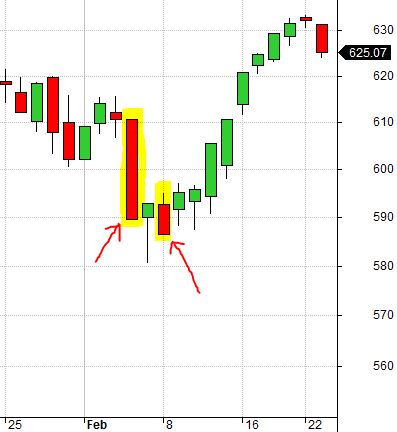
While the market went a few points lower on 2/8/2010, being close to February expiration allowed accelerated time decay to offset the move. Were this a March position, 2/4/2010 probably would have been a false bottom.
Here is a false bottom from 5/7/2010:
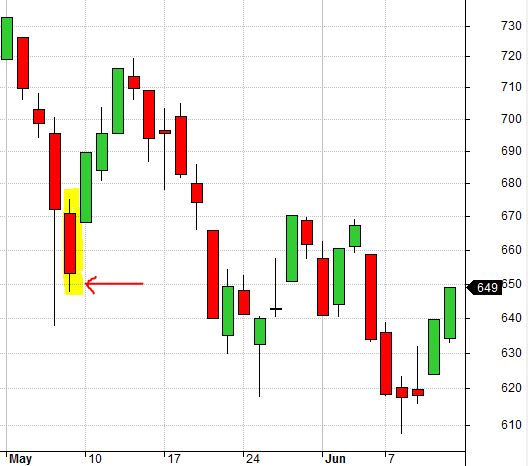
This would have been a real bottom for a May position but with the additional month to expiration, the market had time to recover and then fall once again.
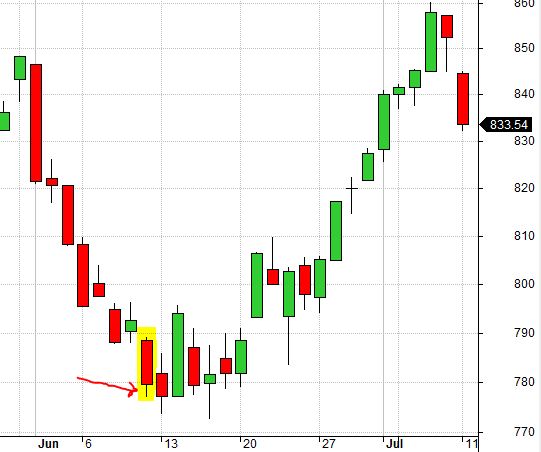
Here is a false bottom from 6/10/2011:
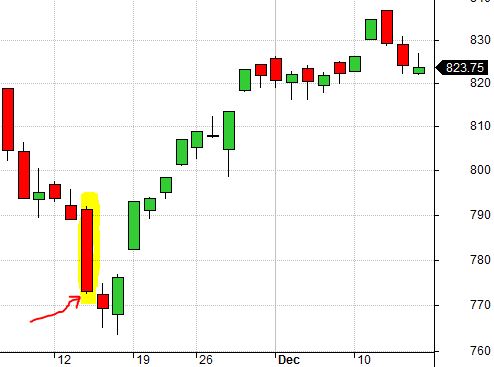
Here is a false bottom from 11/14/2012:
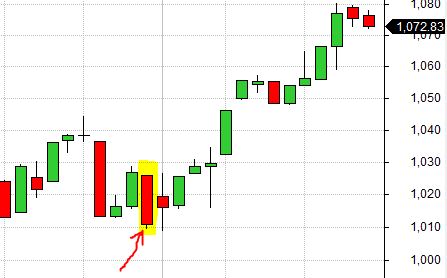
Real bottom from 8/30/2013:
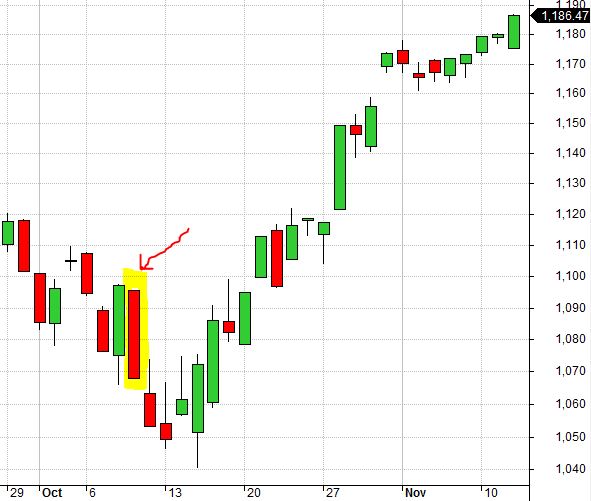
False bottom from 10/9/2014:
False bottom from 8/21/2015:
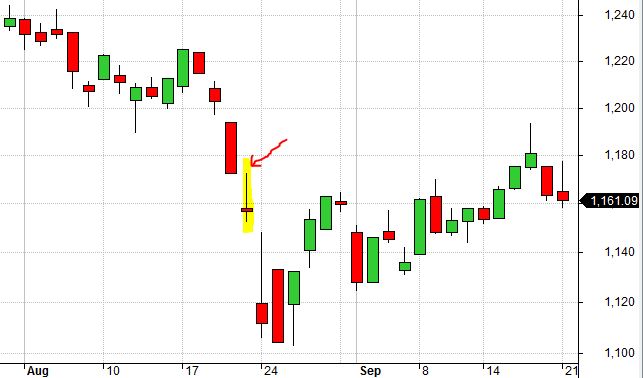
Here is a false bottom from 1/20/2016:
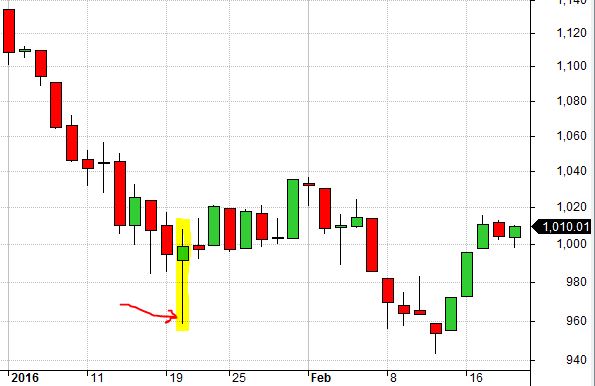
This is another big wick but a lot can happen with several weeks to expiration.
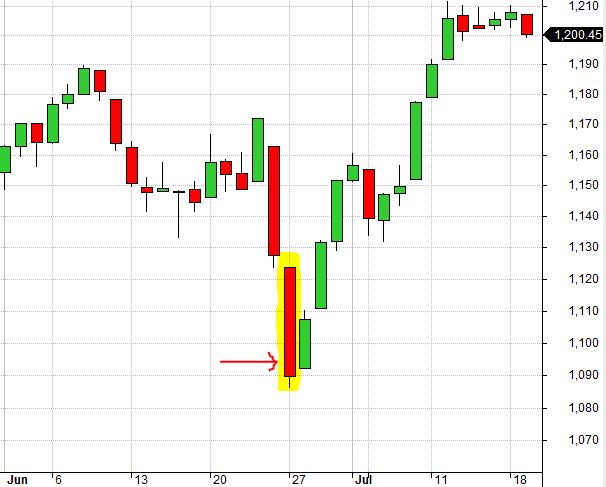
Finally, here is a real bottom from 6/27/2016:
While spreadsheets are great at managing large volumes of data and allowing us to do computational operations quite efficiently, we also have to be cognizant of what information they do not reveal. Besides outright fraud, I believe oversights like these are a major contributor to falsely optimistic backtesting results. This is a good reason why even advanced traders are best advised to undertake system development with others capable of proofreading the work.