Bullish Iron Butterflies (Part 3)
Posted by Mark on August 28, 2017 at 06:50 | Last modified: May 30, 2017 14:47Previous posts (here, here, and here) have led me to think I need to redo this backtest with a lowering of transaction fees from $26 to $6/contract. Because that’s going to take months, I have been deliberating over what I might be able to do beforehand to salvage the data I already have. Today I want to focus on spread width.
I have a trade-off to consider when choosing the width of a butterfly trade. The wider the butterfly, the wider the breakevens and the greater the probability of profit. The breakeven widening is less than proportional to width while the total expense (margin requirement: MR) is directly proportional, though. Why spend so much more on a wider trade to get less of an increase in breakevens? Because in terms of ROI (a percentage), I am likely to suffer a smaller loss if the market does not go my way. In other words, the market will have to move more for me to suffer 100% loss on a wide butterfly than a narrow one.
Flying under the radar of the BIBF analysis to date is the fact that I have completely left cost (spread width) out of the discussion. Despite the absence of a critical detail, the analysis appears to stands on its own: anyone disagree?
That changes today. I will stratify performance by spread width to start:
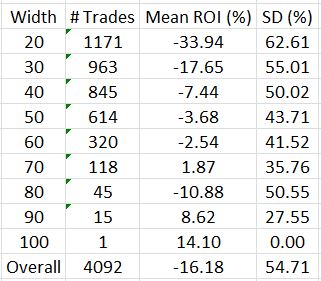
Note the dramatic ROI improvement as width increases. This corroborates the statement above that narrower butterflies are at greater risk of suffering larger percentage losses.
I have two observations to make with regard to standard deviation (SD). First, more winners and losers (on either side of zero) should contribute to larger SD. This could explain the inverse relationship between SD and spread width. Second, I would expect SD to increase with small sample sizes. While sample size (# trades) also appears to be inversely proportional to spread width, I do have acceptable sample sizes up to the 60-70-point categories. I therefore would attribute this inverse relationship more to a greater winning percentage than to higher sample sizes.
The table once again illustrates the average trade of -16%, which corresponds to the 0.44 profit factor. These numbers, reported earlier, led me to say “I do not think this is an optimistic start!”
I can eliminate spread width as a variable by taking the gross margin requirement for the widest trade (100 points * $100/point = $10,000) and allocating that for each trade. By trading this way, I am using only 20% of my capital for a 20-point ($2,000) butterfly:
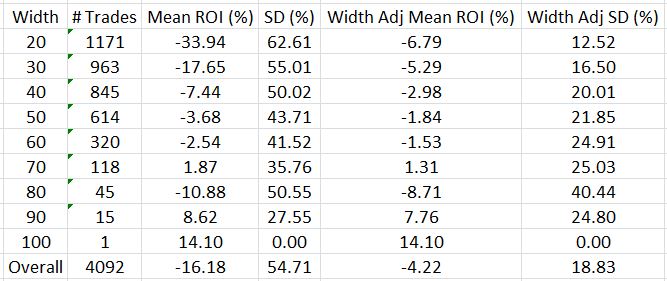
Instead of -16.18%, the average trade is now -4.22%. That is a big difference!
I will continue this discussion in the next post.
Comments (2)
[…] numbers are very similar to those shown last time for spread width. This is probably because the increased IV causes a similar increase in both credit received and […]
[…] IV does not seem to offer much of an edge. You may recall that the average width adjusted ROI across all trades is -4.22%. The green cells correspond to ROI […]