Bullish Iron Butterflies (Part 4)
Posted by Mark on August 31, 2017 at 06:18 | Last modified: June 2, 2017 14:12Today I continue my discussion about stratifying performance by spread width.
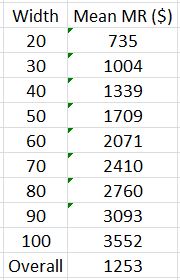
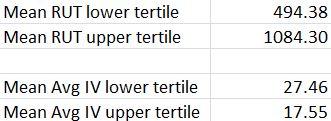
I could go one step further and adjust for margin requirement (MR), which is really net MR (spread width was gross MR; I loosely refer to either as “cost of trade”). Perhaps the 100-point trade does not actually cost five times more than the 20-point trade because more credit is received as implied volatility (IV) increases. Here are the data adjusted for MR:
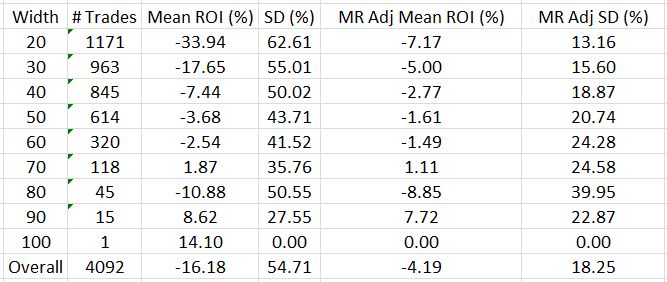
These numbers are very similar to those shown last time for spread width. This is probably because the increased IV causes a similar increase in both credit received and width:
I feel compelled to point out that this entire analysis is retrospective. I have identified the largest spread width and normalized all trades based on that value after completing the backtesting. Should I have a larger width in the future then all these results will change. This is called a “future leak” and is potentially a fatal flaw because I cannot possibly “trade like I backtest:” retrospective data is past whereas live trading is present.
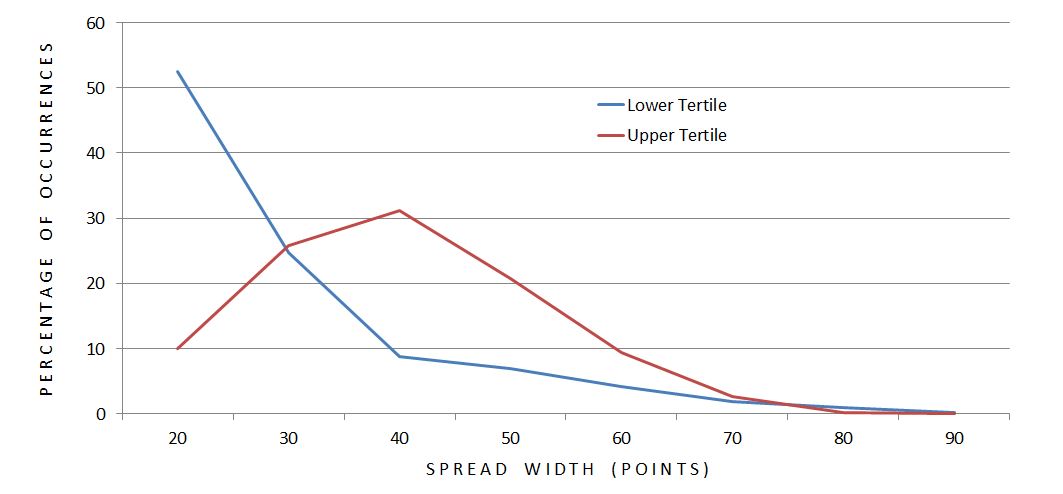
Intuitively, I feel as the underlying goes higher, the cost of these butterflies and the spread widths will tend to increase. To study this, I first sorted trades by underlying price and compared the distribution of lower and upper tertiles:
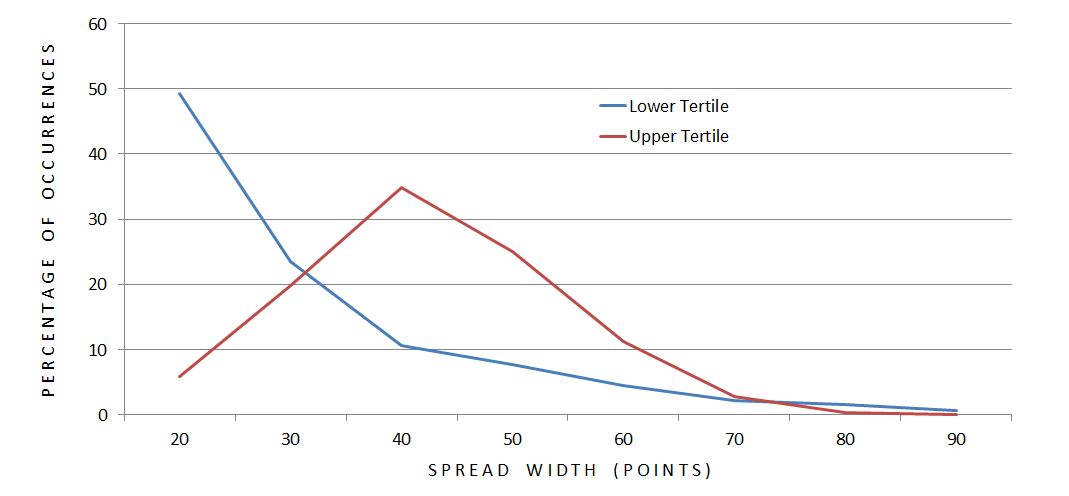
The most common width for the lower (upper) tertile was 20 (40) points. I did notice an imbalance between total trades in the groups: 1829 (880) in the lower (upper) tertile. I therefore repeated the analysis defining tertiles by number of trades:
These results are pretty much the same with 1364 trades in each tertile.
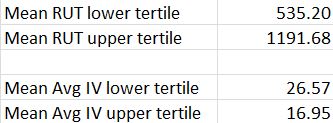
Based on this analysis I would conclude underlying price and spread width to be directly proportional. This relationship seems robust, too, since it overcomes IV trend; despite average IV being greater at lower underlying prices, the average spread width is greater at higher underlying prices.
This puts me at risk for a future trade that will cost more than those seen in backtesting. The solution is to trade these butterflies “small,” although I am a ways away from defining precisely what that means.
Categories: Backtesting | Comments (0) | Permalink