Trading System #1–SPY VIX (Part 10)
Posted by Mark on October 26, 2012 at 09:05 | Last modified: October 15, 2012 10:04In http://www.optionfanatic.com/2012/10/25/trading-system-1-spy-vix-part-9, I presented a MAE graph that damaged any hopes for implementing a protective stop-loss. Today I want to nail this down and make a decision.
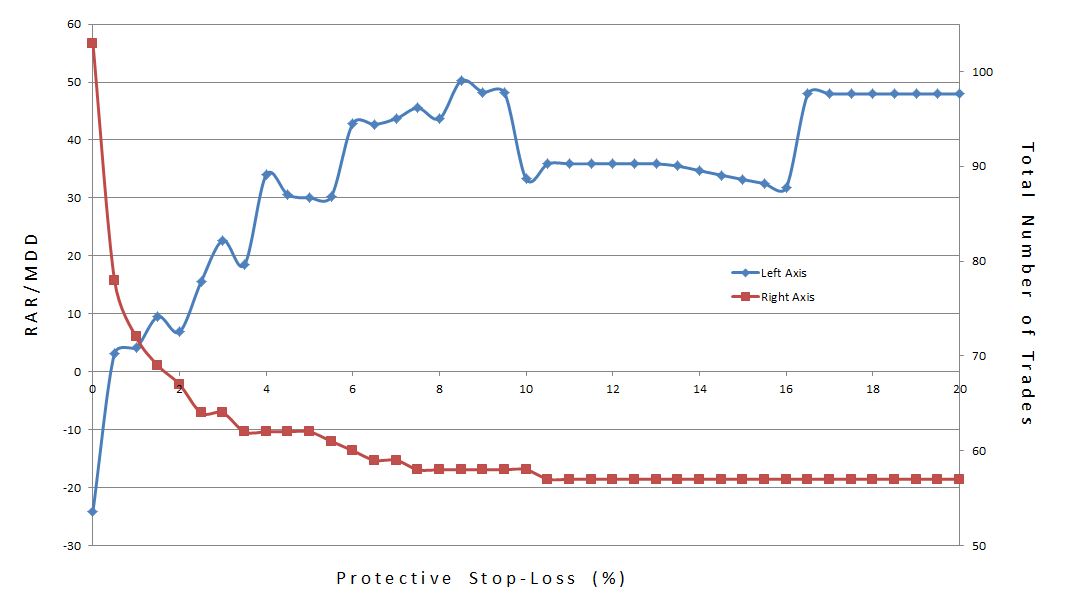
The MAE graph can only hint indirectly about an optimal stop-loss level. A graph of the subjective function vs. different stop levels is more definitive. As with other graphs of the subjective function, what I want to see is a high plateau region rather than spikes or trends. Below, RAR/MDD is plotted vs. stop-loss where the latter is varied from 0% to 20% by 0.5% increments:
The blue line trending from low to high with a dip in the middle suggests that the system becomes more profitable as the stop-loss is relaxed from zero. The graph clearly shows why tight stops are seldom recommended. While the middle is a plateau region, the fact that it is a valley rather than a peak suggests it is less profitable than a wider stop.
The dip is explained by one trade that had a MAE of 16.45% with a final loss of 0.2%. A stop level up to 16.45% would have caused this trade to exit at the stop level (locking in a loss up to 16.45%). Once the stop level exceeded 16.45%, however, the trade was allowed to rebound and lose the modest 0.2%.
The red line, which indicates total number of trades, decreases as the stop-loss increases. This is because the more often trades are stopped out, the more additional days are freed up for new trades to be opened. Recall that this system only trades one open position at a time.
In conclusion, I do not feel any protective stop-loss should be used with this system at all. I will discuss this more in the context of position sizing.
Categories: Backtesting | Comments (0) | Permalink