Trading System #1–SPY VIX (Part 4)
Posted by Mark on October 3, 2012 at 23:03 | Last modified: October 4, 2012 06:32Today I will begin to analyze results of the SPY VIX trading system optimization study. Please refer to Tables 2A and 2B from http://www.optionfanatic.com/2012/10/02/trading-system-1-spy-vix-part-3-2 for the backtest results.
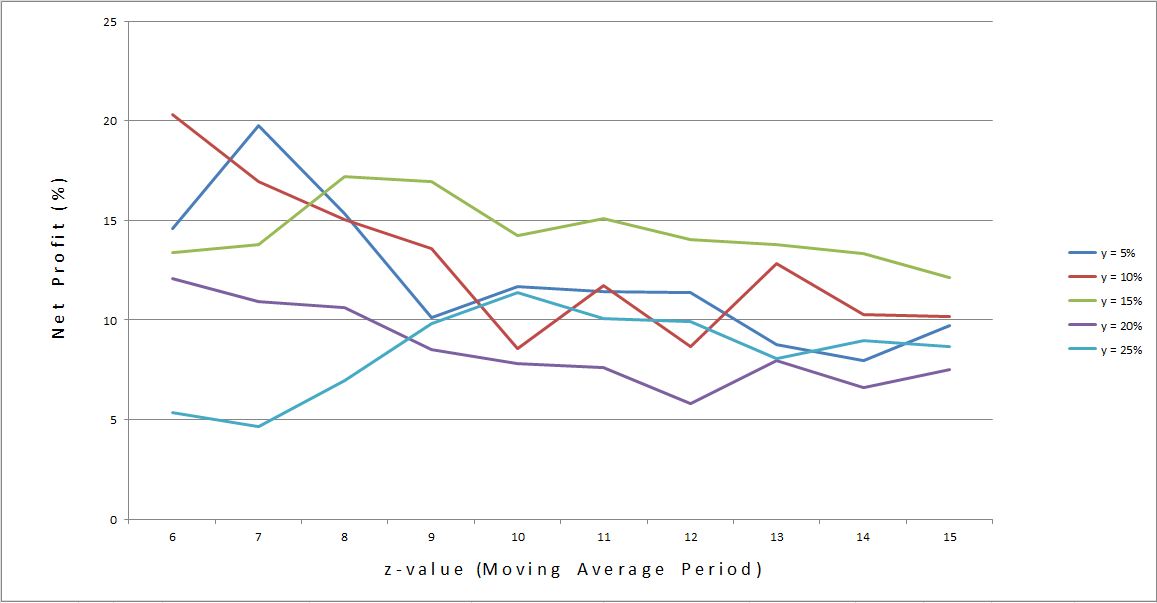
My first observation is that each of the 50 parameter combinations leads to a profitable system! Net profit % ranges from 4.66% to 20.30%. Remember that the issue we’re ultimately trying to address is how probable it is that the system we are backtesting will generate profit going forward. All parameter combinations backtesting profitably makes me more confident that the chosen system will be profitable in live trading than if all parameter combinations did not backtest profitably.
While this conclusion may seem obvious, it does head off the tendency to infer more from the observation than is actually presented. Beginning (and seasoned!) traders are all-too-often eager to enter the market with any half-decent excuse for a [potentially] winning system, open their bags, and let the money fall in. This is the allure/mirage of Wall Street (otherwise known in human nature terms as “greed”). The harsh reality is quite to the contrary. It takes great effort to develop profitable systems and we have just begun. Perhaps “all backtested systems profitable” is one of our checkpoints but our checklist better be much longer if we are to have a realistic chance of being good and not lucky (or worse).
Following the course of evolutionary operation, I now want to analyze returns of each y-value individually:
What line(s) has large plateau regions rather than spike regions? The red line seems to dive early (e.g. from z = 6-10) and then flatten out. The blue line goes up and then way down before flattening. The green line seems relatively flat. The light blue line rises early on and then retraces half that rise. The purple line falls gradually but seems pretty flat from z = 9-15.
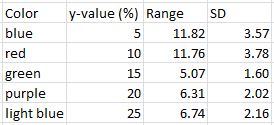
This eyeball method is consistent with a cursory statistical analysis:
Green and purple lines vary the least (flatness).
The one problem I have with this method is the percentage nature of the dependent variable. That is, falling from 20(%) to 15(%) or 10(%) to 5(%) are both a range of 5% but the former is a 25% difference whereas the latter is a 50% difference.
That criticism aside, based on these data I would choose y = 15% and z = 10 (near the middle of plateau regions).
I will continue this analysis in future posts.
Categories: Backtesting | Comments (1) | Permalink
