The Subjective Function (Part 3)
Posted by Mark on October 9, 2012 at 05:37 | Last modified: September 28, 2012 07:30I keep coming up with quirky analogies for different aspects of the system development process. In http://www.optionfanatic.com/2012/09/19/trading-system-1-initial-assessment-part-1/ on 9/19/12, I talked about a Motion to Dismiss. On 10/8/12 (http://www.optionfanatic.com/2012/10/08/the-subjective-function-part-2), I talked about visiting the eye doctor. As promised, today I will present some graphs for study to help determine the subjective function.
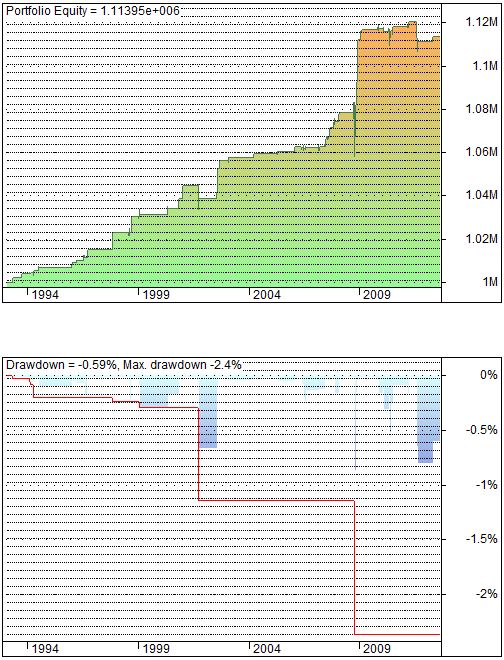
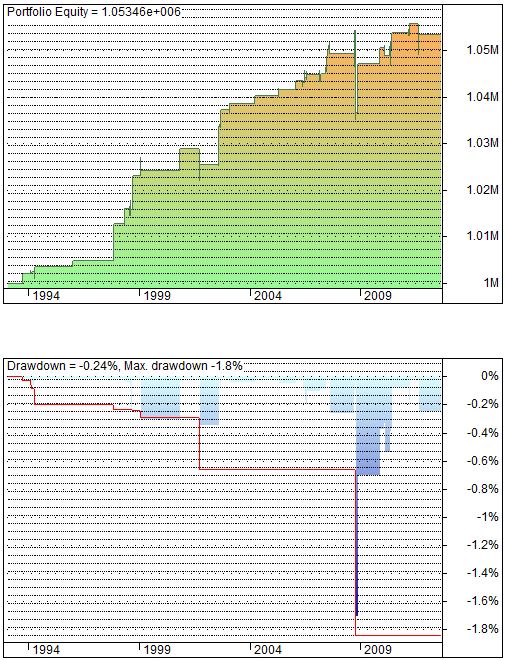
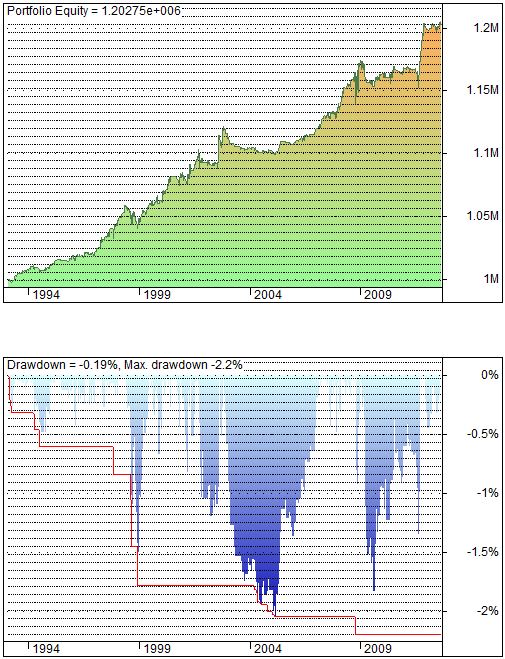
The following inserts show two graphs each. On the top is the equity curve itself: a plot of account value over time beginning with $1M and traded with a $100K position size. On the bottom is the drawdown (DD) curve. DD is zero whenever the account is at a new high. The red line on this graph tracks the max DD ever seen over the whole time period. You will see the red line dip to levels not seen in the blue graph but that is only because the DD was too short to be seen in the blue graph. If you were able to zoom in and magnify then you would see the blue graph dip to those levels.
As you look the following three inserts, imagine that you are studying the performance of your investment account over time. Which would you feel best about? Note details such as relative net profit (final value is shown in the upper left of the top curves), relative severity of drawdowns (current drawdown at the right edge of the bottom curves is shown in the upper left of the bottom curves), relative time between new equity highs, number of horizontal periods (indicating no current trade), etc.
Now without further ado, let me present…
Insert #1:
Insert #2:
Insert #3:
I will analyze these graphs based on my preferences in the next post.
Categories: System Development | Comments (1) | Permalink

