Trading System #1–SPY VIX (Part 7)
Posted by Mark on October 19, 2012 at 08:09 | Last modified: October 7, 2012 11:27In http://www.optionfanatic.com/2012/10/17/trading-system-1-spy-vix-part-6, I determined that for x = 5, y = 25% produced the best backtesting results for z-values between 6-15 (see first paragraph of http://www.optionfanatic.com/2012/10/18/laziness-dissected for a refresher on the SPY VIX trading system). I now want to see if this holds for x = 3 to 7.
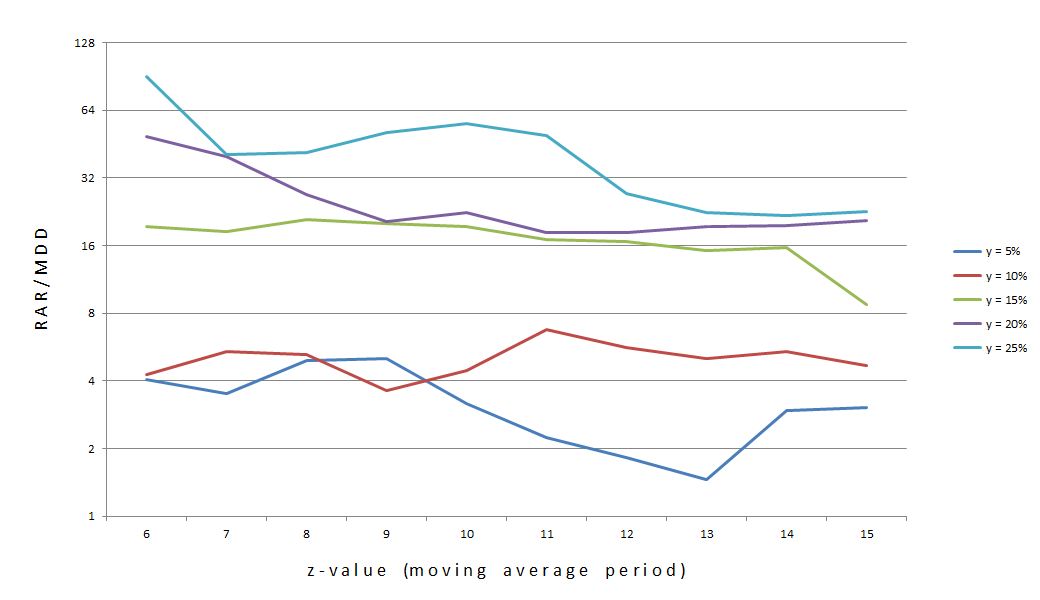
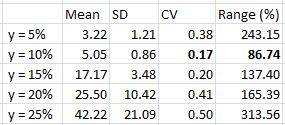
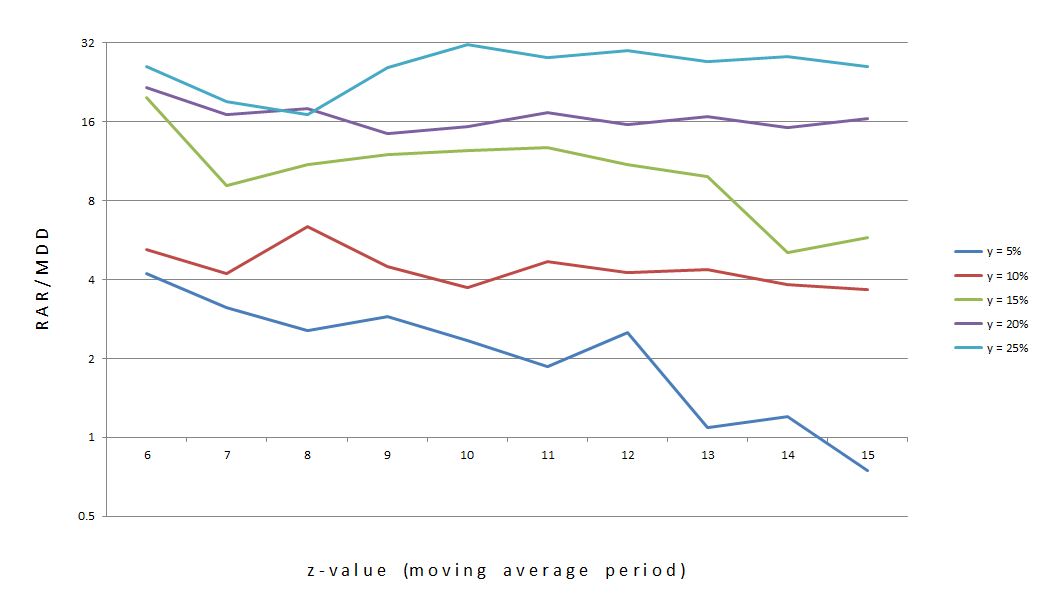
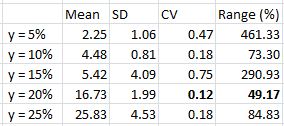
Here is the graph and statistical analysis (lowest stability numbers in bold) for x = 3:
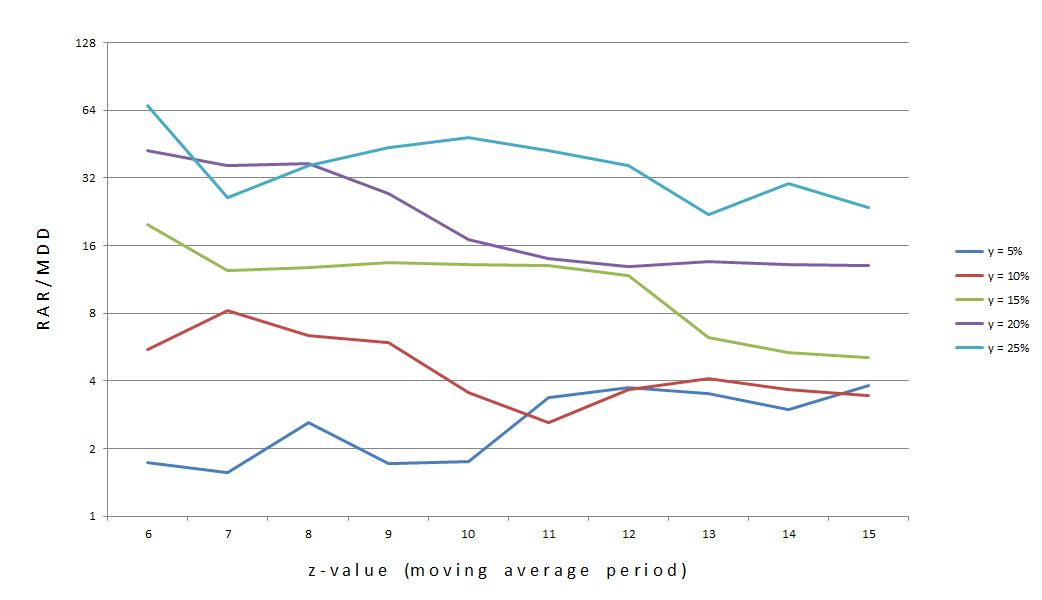
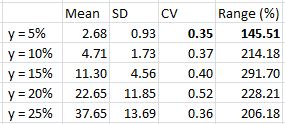
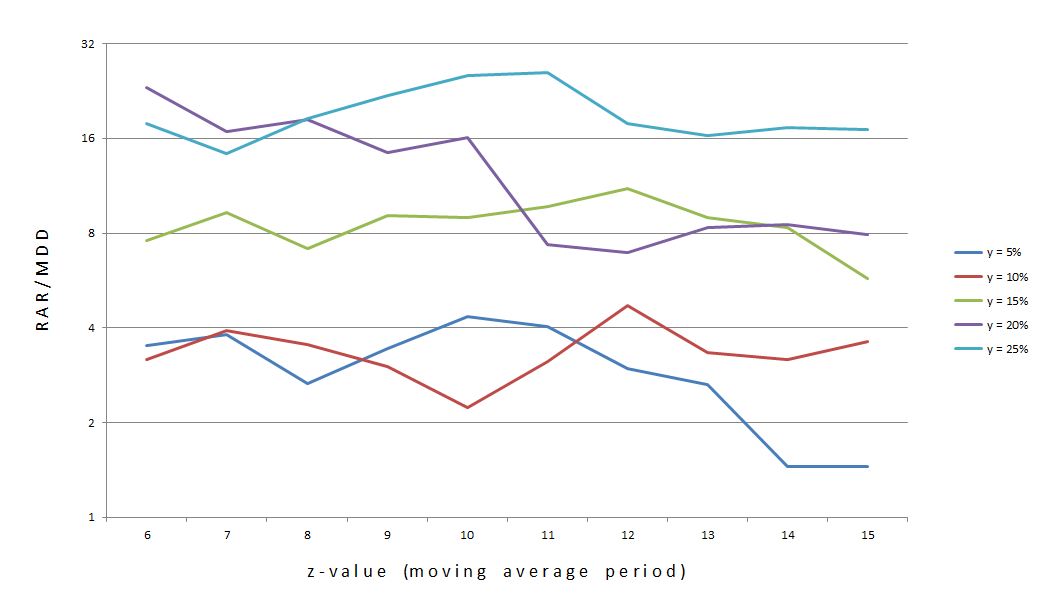
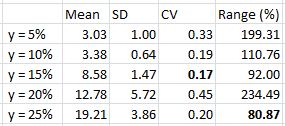
Here is the graph and statistical analysis (lowest stability numbers in bold) for x = 4:
Here is the graph and statistical analysis (lowest stability numbers in bold) for x = 6:
Here is the graph and statistical analysis (lowest stability numbers in bold) for x = 7:
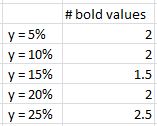
Which value of y had the most stable curves as measured by lowest CV (SD / mean) and lowest Range (%) statistics?
No edge there…
The y = 25% curve prints the largest RAR/MDD for most values of z on all graphs. Out of 50 total backtested systems, RAR/MDD was largest along the y = 25% curve 44 times (by random chance alone, one would expect 10). Six times, y = 20% resulted in a larger RAR/MDD value. These six cases occurred with z = 6 (once), z = 7 (three times), or z = 8 (twice). Never did this occur for z-values of 9-15.
In conclusion, y = 25% is as consistent as any other y-value across all values of x and z. Furthermore, y = 25% reliably scores highest on the subjective function RAR/MAD. In looking at the five y = 25% curves, I would choose z = 10 as the center of the most consistent plateau region where the curve is least likely to fall off “precipitously” at neighboring z-values. Even if the y = 25% curve does fall off, however, RAR/MAD is still very likely to be larger than curves of any other y-value and in all cases would still have generated respectable profit.
Categories: Backtesting | Comments (2) | Permalink