Backtester Development (Part 1)
Posted by Mark on October 24, 2022 at 06:40 | Last modified: June 22, 2022 08:35This mini-series will be a chronicle of backtester development activities. Because so many things are a Python learning experience for me, I think it’s worth documenting them for later review.
I want to start by revisiting the problem I was having with data type conversion. I noted ignorance as to why the problem occurs. My partner filled me in:
> I think this is an excel issue. Do a right click on the file and use the “open
> with” option. Use Notepad. You will see that everything is displayed as float…
> When you open either file with excel, excel creates what looks like an integer.
In other words, this is not actually a problem. Excel makes things look nice, which in this case created an unintentional headache. Having to reformat data from a commercialized vendor source to serve my own purpose should not be surprising.
In the post linked above, I also presented some additional lines to record program duration in a log file. I couldn’t understand why the output data separated by commas was not printing to separate cells in the Excel .csv.
The explanation is the difference between the following two lines:

The commas in L305 are visible only to the Python program. In order to be visible to the application displaying the .csv file, I need to include quotation marks around the commas as if I were printing them (L307).
I enclosed the entire program in a while loop with a new variable timing_count in order to have the program run three times and log multiple elapsed times.
I then assigned current_date in find_long and reset the variable as part of the else block in L77. These were suggestions from Part 11. The program output appears unchanged. Run duration appears consistent and relatively unchanged (as best as I can tell when comparing two sets of three elapsed times each).
The next step is to add the check_second flag (discussed in Part 5), which ended up as a total mess because subsequent debugging took over two hours to seek out a “stupid mistake” (grade-school math terminology) I made in the process.
To refresh your memory especially with regard to the DTE criterion, see second paragraph of Part 6.
My approach to the check_second flag is as follows:
- The previous find_long block is split in two: check_second == False and ELSE (implies check_second == True).
- False includes a nested if statement that checks DTE criterion (ELSE CONTINUE), 10-multiple criterion, then strike price and 10-multiple (redundant) criteria followed by complete variable assignment including flipping check_second to True.
- True (ELSE block) includes a nested if statement that checks for a change in DTE (ELSE CONTINUE), DTE criterion, 10-multiple criterion, then strike price and 10-multiple (redundant) criteria followed by partial variable assignment (SPX price and strike price already assigned), resetting of check_second, assigning find_short to control_flag, and CONTINUE.
- The DTE criterion of True has ELSE block that includes: check_second reset, control_flag = find_short, and CONTINUE.
I will resume next time.
Categories: Python | Comments (0) | PermalinkPKG Stock Study (2-3-23)
Posted by Mark on October 21, 2022 at 07:04 | Last modified: March 1, 2023 14:48I recently* did a stock study on Packaging Corp. of America (PKG) with a closing price of $145.09.
M* writes, “Packaging Corp of America is the third-largest containerboard and corrugated packaging manufacturer in the United States.”
This medium-sized company has grown sales and earnings at annualized rates of 6.8% and 9.8%, respectively, over the last 10 years. Lines are mostly up and parallel except for EPS declines in ’14, ’19, and ’20. PTPM has trended higher over the last 10 years from 11.3% to 16.1% with a last-5-year average of 13.4%. This is significantly higher than peer (stated as CAS.TO, SEE and REYN) and industry averages.
ROE has trended mostly flat since 2014 with a last-5-year average of 23%. Debt-to-Capital has trended lower since 2013 with a last-5-year average of 46.1% (data not available for ’22), which is significantly lower than peer and industry averages. Quick Ratio and Interest Coverage seem acceptable at 1.92 and 11, respectively.
I assume long-term annualized sales growth of 1% based on the following:
- CNN Business projects 3.5% YOY contraction and 1.2% contraction per year for ’23 and ’22-’24, respectively (based on 9 analysts).
- YF projects 3.7% YOY contraction and 0.8% YOY growth for ’23 and ’24, respectively (8 analysts).
- Zacks projects YOY contraction of 4.2% and 0.8% for ’23 and ’24, respectively (4).
- Value Line projects 5.3% growth per year from ’21-’26.
- CFRA projects 1.5% YOY contraction and 0.7% growth per year for ’23 and ’22-’24, respectively.
- M* provides a 2-year growth estimate of 1.1%.
I assume long-term annualized EPS growth of 1% based on the following:
- CNN Business projects 17% YOY contraction and 8.8% contraction per year for ’23 and ’22-’24, respectively (based on 9 analysts) along with 5-year annualized growth of 1%.
- MarketWatch projects annualized contraction of 8.3% and 4.9% for ’22-’24 and ’22-’25, respectively (13 analysts).
- Nasdaq.com projects 0.9% YOY contraction and 0.3% per year growth for ’24 and ’23-’25, respectively (6, 5, and 2 analysts for ’23, ’24, and ’25).
- Seeking Alpha projects 5-year annualized growth of 3%.
- YF projects YOY contraction of 17.3% for ’23 and 5-year annualized contraction of 7.7% (8).
- Zacks projects YOY contraction of 18.2% and 0.9% for ’23 and ’24, respectively, along with 5-year annualized growth of 5% (5).
- Value Line projects annualized growth of 8.4% from ’21-’26.
- CFRA projects 16.8% YOY contraction and 8.3% contraction per year for ’23 and ’22-’24, respectively, along with 3-year annualized growth of 2%.
- M* estimates long-term annualized contraction of 1.6%.
My Forecast High P/E is 14. Over the last 10 years, high P/E has ranged from 14.4 (’13) to 28.7 (upside outlier in ’20) with a last-5-year average (excluding the outlier) of 16.4.
Forecast Low P/E is 8. Over the last decade, low P/E has ranged from 8.5 (’13) to 14.7 (’20) with a last-5-year average of 12.
My Low Stock Price Forecast of $88.10 is default. This is 39% below the last closing price. The low of the last two years is $110.60, but given such dim growth prospects, the Forecast Low P/E seems reasonable.
All this results in an U/D ratio of 0.3, which makes PKG a SELL. The Total Annualized Return computes to 4.7%.
Over the last 10 years, Payout Ratio has ranged from 33.8% (’13) to 69.6% (upside outlier in ’20) with a last-5-year average (excluding the outlier) of 42.5%. I used 34% as a conservative estimate.
Although the current yield (3.4%) is a bright point for this stock, a PAR (using Forecast Average, not High, P/E) of 0.5% is an exclamation point for what is otherwise a depressing stock study. One of BI’s core principles is to buy stock in high-quality growth companies. While PKG has demonstrated consistent historical growth, the outlook for future growth is muddy at best. With the stock up about 17% in just over three months, it’s now far past the BUY zone.
I like to assess margin of safety (MOS) by comparing my inputs with Member Sentiment (MS). Out of 68 studies over the past 90 days, projected sales, projected EPS, Forecast High P/E, and Forecast Low P/E average 5.4%, 6.3%, 17.8, and 11.8. I am dramatically lower on all inputs. Value Line also projects an average annual P/E of 19, which is higher than MS 14.8 and much higher than my 11. I do see a large MOS in this study, but with the wide range of long-term EPS estimates on either side of zero, I also see good reason to be conservative.
MS has a Low Stock Price Forecast of $107.55, which seems reasonable being 20%+ below the last closing price. I just cannot be convinced to raise mine at this time, however [which would increase the U/D ratio]. Seven long-term EPS growth estimates average 1.7%. My forecast is not much lower, and I would not be surprised to see P/E fall to the bottom of its 10-year range given such anemic growth.
*—Publishing in arrears as I’ve been doing one daily stock study while posting only two blogs per week.
Data Type Conversions with the Automated Backtester
Posted by Mark on October 18, 2022 at 06:45 | Last modified: June 22, 2022 08:36I’ve struggled mightily trying to figure out how to handle types for the option data. I think the current solution may be as good as any and today I’m going to discuss how I got to this point.
The data file is .csv with the following [skipping position zero] fields:
- Date (e.g. 17169)
- DTE (e.g. 1081)
- Stock Price (e.g. 2257.83)
- Option Symbol (e.g. SPX 191220P02025000)
- Expiration (e.g. 18250)
- Strike (e.g. 2025)
- Mean Price (e.g. 203.2)
- IV (e.g. 0.209406)
- Delta (e.g. -0.30844)
- Vega (e.g. 13.1856)
- Gamma (e.g. 0.000417)
- Theta (e.g. -0.12758)
For now, I need the following fields as integers (floats for the decimal portion): 1, 2, 5, 6 (3, 7, 8, 9, 12).
Iterating over the first line of data in the file (skipping the header) with L59 (seen here) yields:

Every field I need as an integer comes up with a .0 at the end. When I try to convert to integer with int(), I get a traceback:
> ValueError: invalid literal for int() with base 10: ‘17169.0’.
I can use int(float())) every time I need to encode data from these columns. I do this 21 times in the program. It may seem like an a lot of unnecessary conversion, but I don’t want to see those trailing zeros in the results file.
If I understood why this happens in the first place, then I might be able to nip it in the bud.
Here’s a short code that works:
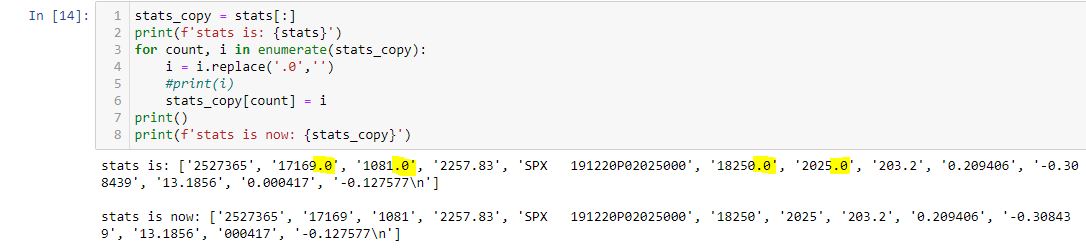
Note that each trailing zero (highlighted) is eliminated. This seems like a lot of preprocessing. The fields remain as strings (note the single quotes) and I still have to convert them to integers.
Is all this faster than 21 instances of int(float())?
I mentioned timers a couple times in this post discussing backtester logic. The following is one approach:
import time
start_time = time.time()
elapsed_time_log = open(r”C:\path\timelog.csv”,”a”)
——————-BODY OF PROGRAM——————-
now = datetime.now()
dt_string = now.strftime(“%m/%d/%Y %H:%M:%S”)
end_time = time.time()
elapsed_time = end_time – start_time
comment = ‘v.9′
print(dt_string,’ ‘, elapsed_time,’ ‘, comment, file=elapsed_time_log)
elapsed_time_log.close()
This code snippet appends a line to a .csv file with time and date, elapsed time, and a comment describing any particular details I specify about the current version. This will give me an idea how different tweaks affect program duration.
As a final note, the code screenshot shown above does not work if L1 reads stats_copy = stats because the original list then changes. This gave me fits, and is probably something every Python beginner encounters at least once.
What’s the problem?
With stats_copy = stats, I don’t actually get two lists. The assignment copies the reference to the list rather than the actual list itself. As a result, both stats_copy and stats refer to the same list after the assignment. Changing the copy therefore changes the original as well.
Aside from the slicing implemented in L1, these methods should also work:
- stats_copy = stats.copy()
- stats_copy = list(stats)
-
Categories: Python | Comments (0) | Permalink
NFLX Stock Study (2-2-23)
Posted by Mark on October 13, 2022 at 07:04 | Last modified: July 25, 2023 10:51I recently* did a stock study on Netflix Inc. (NFLX) with a closing price of $361.99.
CFRA writes, “Netflix is the world’s largest Internet subscription service for accessing TV shows and movies.”
This large-sized company has grown sales and earnings at annualized rates of 26.6% and 58.4%, respectively, over the last 10 years. Lines are mostly up and parallel except for EPS declines in ’15 and ’22. PTPM has trended higher over the last 10 years from 3.9% to 16.6% with a last-5-year average of 13.4%. This trails peer (stated as PARA and FOX) and industry averages.
ROE has trended up from 9.2% to 21.6% over the last 10 years with a last-5-year average of 26%. Debt-to-Capital increased from 27.3% in ’13 to 66.4% in ’18 before declining to 40.9% in ’22. The last-5-year average is 56.5%, which is higher than desired. Interest Coverage is somewhat reassuring at 8, but Quick Ratio offers little comfort at 0.96. As of Q2 2022, the M* analyst describes the company “in a decent position” with $14.2B long-term debt and $7.8B cash. Management has stated the firm should not need to tap the credit market in the future to fund its ongoing content spending, but this can always change.
I assume long-term annualized sales growth of 8% based on the following:
- CNN Business projects 8.5% YOY and 10.2% per year for ’23 and ’22-’24, respectively (based on 36 analysts).
- YF projects YOY 8.9% and 11.8% for ’23 and ’24, respectively (32 analysts).
- Zacks projects YOY 8% and 11.6% for ’23 and ’24, respectively (12).
- Value Line projects 9.7% annualized growth from ’21-’26.
- CFRA projects 9.4% YOY and 10.5% per year for ’22 and ’21-’23, respectively.
- M* provides a 2-year estimate of 10.2%.
I assume long-term annualized EPS growth of 8% based on the following:
- CNN Business projects 13.7% YOY and 19.6% per year for ’23 and ’22-’24, respectively (based on 36 analysts), along with 5-year annualized growth of 24%.
- MarketWatch projects 17.8% and 20% per year for ’22-’24 and ’22-’25, respectively (45 analysts).
- Nasdaq.com projects 26.6% and 28.9% per year for ’23-’25 and ’23-’26, respectively (14, 7, and 2 analysts).
- YF projects YOY 14.9% and 26.2% for ’23 and ’24, respectively, along with 16% per year for the next 5 years (32).
- Zacks projects YOY 11.9% and 28.3% for ’23 and ’24, respectively, along with 19.2% per year for the next 5 years (14).
- Seeking Alpha projects 5-year annualized growth of 24.5%.
- Value Line projects 7.7% per year from ’21-’26.
- CFRA projects 16.6% YOY and 21.5% per year for ’22 and ’21-’23 along with 3-year annualized growth of 18%.
- M* gives a long-term estimate of 18.2%.
I’m forecasting near the bottom of the long-term-estimate range (8.9% – 26%). Because a rebound is forecast following a sharp [quarterly] EPS drop in ’22, I decided to override projection from the last annual (vs. quarterly) data point.
My Forecast High P/E is 35. High P/E has come down from 210 in ’13 to 61.3 in ’22 with a last-5-year average trending lower at 93.9. At some point, I expect P/E to fall into a “normal” range.
My Forecast Low P/E is 25. Low P/E has come down from 49.1 in ’13 to 16.4 in ’22. The last-5-year average is trending lower at 48.1. Again, at some point I expect this to fall into a “normal” range and we may already be starting to see this.
My Low Stock Price Forecast of $247.7 is default. This is 31.2% below the last closing price. The 52-week low price is $162.7.
All this results in an U/D ratio of 1.3, which makes NFLX a HOLD. The Total Annualized Return (TAR) is projected at 7.2%.
A PAR (using Forecast Average, not High, P/E) of 3.9% dictates waiting for a lower price. I certainly see room for downside stock volatility as my Low Stock Price Forecast is > 50% above the 52-week low.
If I can glean any current optimism for buying prospects then it would be in the margin of safety, which I can assess through comparison with Member Sentiment (MS). Out of 333 studies over the past 90 days, projected sales, projected EPS, High P/E, and Low P/E average 12.9%, 11.8%, 65.3, and 54.3, respectively. I am lower on all inputs—especially on P/E. Value Line projects a future average annual P/E of 35.5, which is also higher than my 30.
MS has a Low Stock Price Forecast ~$239, which is lower than mine. A closer look reveals some projected lows over $300 (some much higher than the current price) and some under $100. When I exclude these 67 studies, the MS Low Stock Price Forecast drops to $198.69. While that would pull NFLX even farther from the Buy zone in my study, at -31.2% I think my Low Stock Price Forecast is sufficient.
Projected High Price is where my study really diverges from MS: $511 vs. their $1,135.
*—Publishing in arrears as I’ve been doing one daily stock study while posting only two blogs per week.
Backtester Logic (Part 11)
Posted by Mark on October 10, 2022 at 06:45 | Last modified: June 22, 2022 08:35Moving on through the roadmap presented at the end of Part 9, let’s press forward with trade_status.
trade_status operates as a column in btstats to indicate trade progress and as a control flag to direct program flow.
You may have noticed the former by looking closely at the dataframe code snippet from Part 10. In the results file, this describes each line as ‘INCEPTION’, ‘IN_TRADE’, ‘WINNER’, or ‘LOSER’ (also noted in key).
As a control flag, trade_status is best understood with regard to the four branches of program flow (i.e. control_flag). The variable gets initiated as ‘INCEPTION’. This persists until the end of the find_short branch when it gets assigned ‘IN_TRADE’. At this point, the program no longer has to follow entry guidlines but rather match existing options (see third paragraph of Part 2). Once the whole spread has been updated at the end of update_short, the program can evaluate exit criteria to determine if trade_status needs to be assigned ‘WINNER’ or ‘LOSER’. In either of those cases, the trade is over and:
- Variable reset can occur.
- ‘INCEPTION’ gets assigned to trade_status.
- find_long gets assigned to control_flag.
- wait_until_next_day is set to True.
One variable not reset is current_date. This is needed in L65 (see Part 2) along with wait_until_next_day. For completeness, I should probably reset current_date as part of that else block (L68) and assign it once again as part of find_short or in the find_long branch with trade_date in L75.
With regard to exit logic, I have the following after variables are calculated and/or assigned in update_short:

The only exit criteria now programmed are those for max loss and profit target, but this must be expanded. At the very least, I need to exit at a predetermined/customizable DTE or when the short option expires. This may be done by expanding the if-elif block. If the time stop is hit and trade is up (down) money then it’s a ‘WINNER’ (‘LOSER’).
I will also add logic to track overall performance. I can store PnL and DIT for winning and losing trades in separate lists and run calculations. Just above this, I can check for MAE/MFE and store those in lists for later plotting or processing. I can also use btstats. Ultimately, I’d like to calculate statistics as discussed in this blog mini-series. I will take one step at a time.
I conclude with a quick note about data encoding. Following the code snippet shown in Part 1, I have:
![]()
That imports each option quote into a list—any aspect of which can then be accessed or manipulated by proper slicing.
That ends my review of the logic behind a rudimentary, automated backtester. My next steps are to modify the program as discussed, make sure everything works, continue with further development, and to start with the backtesting itself.
As always, stay tuned to this channel for future progress reports!
Categories: Python | Comments (0) | PermalinkAMZN Stock Study (2-1-23)
Posted by Mark on October 7, 2022 at 06:52 | Last modified: February 27, 2023 17:01I recently* did a stock study on Amazon.com Inc. (AMZN) with a closing price of $103.13.
Value Line writes:
> Amazon.com is the largest online retailers [sic]. The company opened
> its virtual doors in 1995. Sales breakdown (2021): North America;
> 59% of sales. International sales, 27% of total. Amazon Web Services
> (AWS), 14%. Third-party sellers (Marketplace) account for about 20%
> of sales. Seasonality: Q4 accounted for 29% of ’21 revenue.
> Acquired Audible.com, ’08, Zappos, ’09, Whole Foods Market, ’17.
This mega-sized (> $50B annual revenue) company has grown sales at an annualized rate of 26.1% over the last 10 years and EPS 71.1% per year since 2016 (excluding previous years with tiny EPS that skew the historical average even higher). Lines are mostly up and parallel except for EPS decline in ’22. PTPM has trended higher over the last 10 years from ~1% to ~8% with a last-5-year average of 5.3%. This slightly trails peer (stated as VIPS, JDD, and PDD) and industry averages.
ROE has trended up from ~0% to ~27% over the last 10 years with a last-5-year average of 22.1%. Debt-to-Capital has increased from 31.9% to 45.7% with a last-5-year average of 49.8%. This is lower than peer and industry averages. Although Interest Coverage is only 5.6 and the Quick Ratio only 0.68, the M* analyst writes:
> The balance sheet is sound with a net cash position and only modest
> gross debt. We expect the balance sheet to remain sound as the
> company has typically maintained a conservative balance sheet and
> generates more than enough FCF from [Amazon Web Services] and
> advertising to fund growth throughout the business.
I assume long-term annualized sales growth of 8% based on the following:
- YF projects YOY 8.6% and 9.6% growth for ’22 and ’23, respectively (based on 46 analysts).
- Zacks projects YOY 8.6% and 9.1% growth for ’22 and ’23, respectively (13).
- Value Line projects 17.8% growth per year from ’21-’26.
- CFRA projects 13.3% YOY and 10.8% per year for ’22 and ’21-’23, respectively.
- M* provides a 2-year estimate of 8.6%.
I assume long-term annualized EPS growth of 9% based on the following:
- CNN Business projects 5-year annualized growth of 12.2%.
- MarketWatch projects annualized ACE of -8.1% and 11.6% for ’21-’23 and ’21-’24, respectively (based on 54 analysts).
- Nasdaq.com projects 65.8% YOY and 66.9% per year for ’24 and ’23-’25, respectively (12, 8, and 4 analysts).
- YF projects YOY growth of -103.7% and 1433% as negative ’22 earnings rebound in ’23 off a fractional base (46).
- YF also gives a 5-year annualized estimate of 26%.
- Zacks similarly projects YOY growth of -104.3% and 1228% as earnings turn negative in ’22 then rebound in ’23 (11).
- Zacks gives a 5-year annualized estimate of 18%.
- Value Line projects annualized growth of 21.2% from ’21-’26.
- CFRA projects -103.7% YOY and -24.6% per year for ’22 and ’21-’23, respectively.
- M* gives a long-term growth estimate of 8.9%.
I’m forecasting near the bottom of the long-term-estimate range (8.9% – 26%). Because a rebound is forecast following a sharp [quarterly] EPS drop in ’22, I decided to override projection from the last annual (vs. quarterly) data point.
My Forecast High P/E is 35. Since 2016, high P/E has eased from 173 to 58.2 (2021). The last 5-year average is 106.1. At some point, I expect P/E to fall into a “normal” range, but predicting when this happens is like taking a shot in the dark.
My Forecast Low P/E is 25. Since 2016, low P/E has eased from 97 to ~44 (2021) with a last 5-year average of 65.3. I expect this to fall into a “normal” range eventually (I’m astounded that this hasn’t happened already to the mega-sized company).
My Low Stock Price Forecast is $81. The default low price is $27.30 based on the depressed $1.09 EPS. This does not seem reasonable. Instead, I will use the 2020 low price of $81.30, which is 21% below the last closing price.
All this results in an U/D ratio of 3.2. This makes AMZN a BUY with a Total Annualized Return (TAR) of 11.1%.
AMZN’s 17% ownership stake in RIVN is what makes this analysis so complex. AMZN lost $10.4B over the first nine months of 2022 due to the drop in RIVN stock price. This is why analysts forecast -100% EPS growth for 2022 and why some 2023 [provided that RIVN shares do not continue the precipitous decline] growth projections are over 1000%. In my view, any math amounting to a 20%+ long-term (e.g. 3-5) EPS growth rate after years 1-2 are negative is suspect.
While TAR is decent, PAR (using forecast average, not high, P/E) is only 7.7%. Is it reasonable to expect the former, which is consistent with the highest long-term analyst estimates?
To answer this, I assess margin of safety (MOS) by comparing my inputs with Member Sentiment (MS). Out of 1142 studies over the past 90 days, projected sales, projected EPS, high P/E, and low P/E average 13.9%, 17%, 78.6, and 67, respectively. I am dramatically lower on all inputs.
To calculate average MS Low Stock Price Forecast, I excluded 199 studies using $100 or more. At least half of these were four digits, and I deem all them to be unreasonable and/or invalid. The revised averages are 13.1%, 16.4%, 73.6, and 61.5, respectively: still well higher than mine. The average Low Stock Price Forecast is $70.50, which is lower than mine and would have resulted in a HOLD for this study rather than BUY. I’m not sure how meaningful this is as I would similarly have had a lower Low Stock Price Forecast had I chosen to use the 2020 low—a decision one could argue to be unreasonable.
While my aim is to use MS to evaluate MOS, I wonder if such comparison here might be apples-to-oranges because I don’t know how many changed projection from the last quarterly (default) to annual data point. Nevertheless, both my growth rate and P/E projections are lower than MS. Even if the conservativism of one set effectively offsets the [more aggressive decision to] override from quarterly to annual data point, I still have the other conservative set providing MOS.
And Value Line has a projected average annual P/E of 40 compared to my 30, which further bolters the conservative case.
Despite the lackluster PAR, given the apparent MOS I like a BUY on these shares up to $104.
*—Publishing in arrears as I’ve been doing one daily stock study while only posting two blogs per week.
Backtester Logic (Part 10)
Posted by Mark on October 4, 2022 at 07:11 | Last modified: June 22, 2022 08:35Today I will continue by following the road map laid out at the end of Part 9.
I will begin with the results file. I have been using Jupyter Notebook for development and I can plot some graphs there, but I want to print detailed results to a .csv file. I am currently generating one such file that shows every day of every trade. Eventually, I want to generate a second file that shows overall trade statistics.
The results file gets opened at the beginning and closed at the end of the program with these lines:
![]()
![]()
In an earlier version, I then printed to this file as part of the find_short and update_short branches with lines like this:

While I find the syntax interesting, I realized these are pretty much just string operations that won’t help me to calculate higher-level trade statistics. Numpy will be much better for that, which is why I decided to compile the results into btstats (dataframe). Done that way, I can still get the results file in the end with this line:
![]()
The dataframe is created near the beginning of the program:

Most of the columns have corresponding variables (see key) and/or are derived through simple arithmetic on those variables.
Now, instead of printing to the results file in two out of the four branches I add a list to the dataframe as a new row:

I searched the internet to find this solution here. One nice thing about Python is that I can find solutions online for most things I’m looking to accomplish. That doesn’t mean I understand how they work, though. For example, I understand df.loc[] to accept labels rather than integer locations (df.iloc[], which I have also learned cannot expand the size of a dataframe). len(btstats.index) is an integer so I’m not sure why it works. This is a big reason why I still consider myself a pupil in Python.
L127 is an example of variable reset (discussed in Part 9). This is what I want to do for every variable once it has served its purpose to make sure I don’t accidentally use old data for current calculations (e.g. next historical date).
Let’s take a closer look at L121:
![]()
The data file includes a date field as “number of days since Jan 1, 1970” format. Multiplying that by 86400 seconds/day yields number of seconds since midnight [UTC], Jan 1, 1970, which is the proper format for the datetime module’s UTC timestamp. I can now use the .strftime() method and ‘%b’ to get the first three letters as an abbreviated month name. Being much more readable than a nonsensical 5-digit integer, this is what I want to see in the results file.
The light at the end of the tunnel is getting brighter!
Categories: Python | Comments (0) | PermalinkFOXF Stock Study (1-31-23)
Posted by Mark on September 29, 2022 at 06:45 | Last modified: February 23, 2023 16:40I recently* did a stock study on Fox Factory Holding Corp. (FOXF) with a closing price of $113.39.
Value Line writes:
> Fox Factory Holding Corp. designs, engineers, manufactures, and
> markets performance ride dynamics products for customers
> worldwide. Fox Factory Holding is the holding company of Fox
> Factory, Inc. The company’s premium brand ride dynamics products
> are used primarily on bicycles, side-by-side vehicles, onroad
> vehicles with off-road capabilities, off-road vehicles and
> trucks, all-terrain vehicles, snowmobiles, specialty vehicles
> and applications, and motorcycles.
This medium-sized company has grown sales and EPS at annualized rates of 19.8% and 25.5% over the last 10 years. Lines are mostly up and parallel with slight EPS pullbacks in ’15 and ’20. PTPM over the last 10 years has increased from 9.5% to 14.5% with a last-5-year average of 13.8%. This beats peer (stated as THRM, ALSN, and GTX) and industry averages.
ROE has trended down from 28.5% in ’13 to 19.2% in ’21 with the last five years averaging 20.3%: slightly better than peer and industry averages. Debt-to-Capital has ranged from 8% (’13) to 35.5% (’20) over the last nine years with a last-5-year average of 25.2%: lower than peer and industry averages. Interest Coverage is 28, and the company has no long-term debt.
I assume long-term annualized sales growth of 8% based on the following:
- CNN Business projects 23.1% YOY and 14.4% per year for ’22 and ’21-’23, respectively (based on 6 analysts).
- YF projects YOY 21.4% and 5.4% for ’22 and ’23, respectively (7 analysts).
- Zacks projects YOY 21.4% and 5.1% for ’22 and ’23, respectively (5).
- Value Line projects 8.5% annualized from ’21-’26.
I assume long-term annualized EPS growth of 9% based on the following:
- CNN Business projects 17.1% YOY and 13.3% per year for ’22 and ’21-’23, respectively (based on 6 analysts), along with a 5-year annualized estimate of 14.4%.
- MarketWatch projects annualized ACE of 13.5% and 12.4% for ’21-’23 and ’21-’24, respectively (7 analysts).
- Nasdaq.com projects 9.5% YOY and 9.4% per year for ’23 and ’22-’24, respectively [5, 5, and 1 analyst(s) for ’22, ’23, and ’24].
- YF projects YOY 17.1% and 9.7% for ’22 and ’23, respectively, and 15% annualized for the next five years (7).
- Zacks projects YOY 17.1% and 9.5% for ’22 and ’23, respectively, and 13.8% annualized for the next five years (5).
- Value Line projects 12.6% annualized from ’21-’26.
I’m forecasting beneath the range (12.6%) of four long-term estimates.
My Forecast High P/E is 27. High P/E has ranged from 26.1 (’14) to 51.1 (’20) and trended higher since 2013. The last-5-year average is 42.9.
My Forecast Low P/E is 15. Low P/E has ranged from 14.7 (’16) to 26.3 (’21) since 2013. The last-5-year average is 20.6.
My Low Stock Price Forecast is $67.20, which is the default value. This is 40% less than the previous closing price and just below the 52-week low of 69.3. The stock has had a big run-up in price over the last few months.
All this results in an U/D ratio of 1.6, which makes FOXF a Hold. Total Annualized Return (TAR) is 10.4%.
While TAR is decent, PAR (using Forecast Average, not High, P/E) is only 5%. I want more from a medium-sized company.
For more context, I like to assess margin of safety (MOS) by comparing with Member Sentiment (MS). Out of 212 studies over the past 90 days, projected sales, projected EPS, Forecast High P/E, and Forecast Low P/E average 12.9%, 13.2%, 31.3, and 18.9, respectively. I’m lower on all inputs and also lower than Value Line’s projected average annual P/E of 25 (vs. 26.1 for MS and 21 for me). The average MS Low Stock Price Forecast is also above mine at $68.87.
The MOS is alive and well in this study: enough to preclude a buy over $97/share.
*—Publishing in arrears as I’ve been doing one stock study per day while usually posting two blogs per week.
Backtester Logic (Part 9)
Posted by Mark on September 26, 2022 at 06:39 | Last modified: June 22, 2022 08:35Having completed analysis of the first two, I now continue with the update_long and update_short branches.
The conditional skeleton for these two branches of program flow looks like this:*
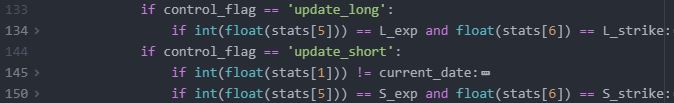
As discussed in the third paragraph of Part 2, rather than follow trade entry criteria these branches just need to locate previous selections. L134 (for update_long) and L150 (for update_short) look to match strike price and expiration. Short and sweet.
Here are considerations with regard to historical date:
- After find_short, historical date should be advanced to update the spread.
- After update_long, historical date should not be advanced since two legs need to be updated on the same date.
- After update_short, historical date should be advanced assuming the trade remains open.
(1) Near the end of find_short, the wait_until_next_day flag is set to True, but current_date has not yet been assigned. I have already discussed this oversight (near end of Part 3 and beginning of Part 4).
(2) update_long does nothing with the wait_until_next_day flag, and…
(3) In L145, update_short checks to make sure historical date has not advanced before progressing to update. If historical date has advanced, then an exception is raised. This should not happen if the data file is complete unless the short option has expired. Whether it be short option expiration or a predetermined DTE, I still need to build in time-stop logic to handle this.
When any branch of program flow finds a match, encoding from the data file assigns to variables shown in the key.
find_short and update_short include several lines devoted to variable reset. Variable reset prevents previous (stale) values to be used in current calculations. Variable reset will only be done as part of find_short if a short option is not found, which itself in an error. To do this effectively, I will make a list to ensure every variable involved in assignment is subsequently reset.
I will also decide whether a user-defined function to reset variables (as mentioned in Part 2 footnote) is indicated.
Is that the light at the end of the tunnel I might be starting to see?
Here are some other topics I still want to discuss:
- Printing to results file
- trade_status
- Rationale behind btstats
- L121 syntax
- Exit logic
- Encoding process
I will continue next time.
*—As discussed in the Part 6 footnote, I’ve used Atom’s folding feature for display purposes, which
means the higher level (indented) lines are hidden from view.
BOOT Stock Study (1-26-23)
Posted by Mark on September 23, 2022 at 06:50 | Last modified: February 23, 2023 11:27I recently* did a stock study on Boot Barn Holdings Inc. (BOOT) with a closing price of $74.37.
From M*:
> Boot Barn Holdings Inc operates specialty retail stores.
> The company sells western and work-related footwear,
> apparel, and accessories in the United States. It is a
> single operating segment, which includes net sales
> generated from its retail stores and e-commerce websites.
This medium-sized company has grown sales at an annualized rate of 18.5% over the last 10 years and EPS 41.8% per year since ’14. Lines are mostly up, straight, and parallel. PTPM over the last 10 years has risen from 0.6% to 17% (upside outlier) with a last 5-year average (excluding the outlier) of 6.6%. This was below peer (stated as BURL and VSCO) and industry averages until ’20.
ROE has increased from 10.1% in ’14 to 34% in ’21 with the latter appearing to be an upside outlier. The last 5-year average is 18.9%, which seems slightly below (above) industry (peer) averages. Debt-to-Capital has averaged 45.7% over the last five years and was higher than peer and industry averages until 2019. The company has no long-term debt [operating leases], though, and Interest Coverage is over 60.
I assume long-term annualized sales growth of 6% based on the following:
- CNN Business projects 13.3% YOY and 9.5% per year for ’22 and ’21-’23, respectively (based on 12 analysts).
- YF projects YOY 11.8% and 6.8% for ’23 and ’24, respectively (13 analysts).
- Zacks projects YOY 12.2% and 7.6% for ’23 and ’24, respectively (5).
- Value Line projects 7.9% annualized from ’21-’26.
- CFRA projects 11.9% YOY and 13% per year for ’23 and ’22-’24, respectively (13).
- M* gives a 2-year ACE of 8.7% per year.
I assume long-term annualized EPS growth of 5% based on the following:
- CNN Business reports ACE of 7.1% YOY contraction and 1.6% per year contraction for ’22 and ’21-’23, respectively (based on 12 analysts).
- MarketWatch projects annualized ACE of 1.6% contraction and 3.2% growth from ’22-’24 and ’22-’25, respectively (13 analysts).
- Nasdaq.com projects growth of 5.2% YOY and 10% per year for ’24 and ’23-’25, respectively (6, 7, and 2 analysts for ’23, ’24, and ’25).
- YF projects YOY 9.6% contraction and 4.4% growth for ’23 and ’24, respectively, along with 11.9% annualized growth for the next five years (13).
- Zacks projects YOY 6.5% contraction and 4.9% growth for ’23 and ’24, respectively, along with 10.6% annualized growth for the next five years (6).
- Value Line projects annualized growth of 2.9% from ’21-’26.
- CFRA projects 9.6% contraction YOY and 2.9% per year contraction for ’23 and ’22-’24, respectively (13).
My Forecast High P/E is 20. High P/E has ranged from 19.3 (’17) to 93.1 (upside outlier in ’15) since 2014. The last 5-year average is 25.6.
My Forecast Low P/E is 6. Low P/E has ranged from 4.9 (’19) to 31.3 (upside outlier in ’14) since 2014. The last 5-year average is 7.2.
My Low Stock Price Forecast is $36.50. This is the default value and 51% below the previous closing price. While this is more than the 20% rule of thumb, given the earnings contraction projected over the next couple years, I don’t see good reason to override (which would effectively be using a higher Forecast Low P/E).
All this results in an U/D ratio of 2.1, which makes BOOT a Hold. Total Annualized Return is 15.9%.
While the total return projection is impressive, PAR (using forecast average, not High, P/E) is a lukewarm 6.3%. I want more from a medium-sized company.
For added context, I like to assess margin of safety (MOS) by looking to Member Sentiment. Out of 120 studies over the past 90 days, projected sales, projected EPS, High P/E, and Low P/E average 10.7%, 9.8%, 21.9, and 8.5, respectively (two studies excluded with Projected High P/E’s of 100 and 2128, which skewed the average Projected High P/E to 39.8). I’m lower on all inputs. Same goes for the average projected low price of $41.90, which is $5.40 higher than mine.
Finally, Value Line has projected average annual P/E at 17 compared to my 13.
It will suffice to say that the MOS is alive and well in this analysis. I’m a buyer on a stock price below $66.
*—Publishing in arrears as I’ve been doing one stock study per day while usually posting two blogs per week.