Mining for Trading Strategies (Part 5)
Posted by Mark on June 30, 2020 at 07:57 | Last modified: June 25, 2020 11:29Today I want to present and discuss results from my initial testing of 2-rule versus 4-rule strategies.
The methodology is given in the third-to-last paragraph here.
I basically developed the strategies with random entry signals and simple exits from 2011-2015 and tested OOS from 2007-2011. I sorted by best performers over the entire 8-year period. I took the top (+/-) 60 (two simulations of ~30 each) and tested from 2015-2019. As the focus of my study, I then tested these strategies from 2015-2019 (incubation).
I applied $25 plus $3.50 / contract-trade to account for transaction fees.
The analysis consisted of T-tests assuming unequal variance in Microsoft Excel. I chose unequal because I had no reason to assume equal variance. I tested on five parameters: PNL, PNLDD, number of trades during incubation, average trade, and PF. Number of trades is not a performance metric and could probably have been left out.
Since I did five statistical comparisons, I adjusted the significance value from 0.05 per Holm Method. I think Holm is better than Bonferroni in this instance because the hypotheses are not independent: all measures of four rules versus two.
Here are the results:
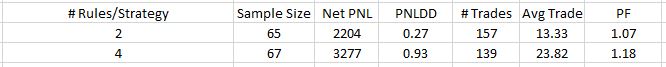
No differences were significant after application of the Holm method.
As I reviewed the study, I found that I made a few mistakes. First, the starting date was 2001 instead of 2007. Second, I had OOS set to 40% of the data instead of 50%. Third, I had cash set to be invested in the Biotech index instead of nothing. The latter probably affected strategies across the board and is nothing to be concerned about. It may have differentially affected the groups if one tended toward more/less time in the market during a period when Biotechs performed significantly better/worse than large-cap US equities.
I would rather do the study correctly before making too much of it. I will look to build on this with later studies.
Categories: System Development | Comments (0) | PermalinkMining for Trading Strategies (Part 4)
Posted by Mark on June 25, 2020 at 07:41 | Last modified: June 22, 2020 13:38Today I resume this blog mini-series with a slightly different approach.
I communicate with an algo trader who has recently gone live with his first strategy. If you have read about or watched algorithmic trading videos for any period of time, then you have seen pictures like his near-perfect equity curve. Also:
- Backtested over 19+ years
- PF > 9
- Total time in market < 30 months
- Maximum drawdown < 9% of initial capital
- Made money every calendar year
- Out of the market entirely for three consecutive years
- Passes Randomized OOS
- Beautiful Monte Carlo analysis
- Monte Carlo DD < backtested DD (see sixth paragraph here)
- Noise Test looks pretty good (which may not mean much)
I started discussing my attempt to validate Randomized OOS and he interrupted to say that I’m using lousy strategies. I was looking at simple, 2-rule strategies. He said I should be using at least four including signal exits. Even then, he said only 0.001% of strategies I find will actually “be good” (I assume by this he meant to be “viable” per this second paragraph).
Realizing his response was personal opinion not based on actual data, a couple things came to mind—the first one being whether I can ever validate a stress test if he is correct. I took one day to go through ~120 strategies; what would it take to show the stress test adds value if only one out of 100,000 strategies are good enough to be viable anyway?
A Chi Square calculator can answer this question. Even one in 2,000 is significantly better than one in 100,000, but that would take at least 17 days of backtesting.
I’m pretty sure 0.001% is way too low (see second paragraph here). I think one in 1,000 (0.1%), if not one in 200 – 500, is more like it. I don’t have actual data on this so I’m going to table it for now.
The second question that came to mind is whether 4-rule strategies are any better than 2-rule strategies?
I figured I could do this study by using the software to build random 2- and 4-rule strategies for long ES over 2007-2015. I ran the simulation for a couple minutes and then stopped. I took the best page of overall results (IS + OOS) and tested those on 2015-2019. I collected data on PNL, PNLDD, total number of trades, average trade, and PF.
I didn’t really have an opinion as to which group I thought would do better. The more rules, the greater the risk of overfitting would mean good performance from 2007-2015 and worse performance thereafter. However, 50% of the former period is OOS, which is not fit to anything. If the strategy is poor OOS then it’s probably not going to be one of the best. These are logical, contradictory ideas and as a result, I approached the results without bias and looked at two-tailed statistics.
I will continue next time.
Categories: System Development | Comments (0) | PermalinkRandom Simulation 1 (Part 2)
Posted by Mark on June 22, 2020 at 07:01 | Last modified: May 22, 2020 11:02Today I will conclude analysis of my first random simulation with the new software.
The more strategies I analyze, the more I hope to learn about what components are correlated with viability and profitability. I will also get a better feel for how representative particular results are relative to all strategies that I’ve studied.
Continuing on with the stress testing, the delay test doesn’t look so great:
I’m not sure how concerning this is. This delays entries and exits by x bars. When the strategy exits at the first profitable close or 15 days—whichever comes first—any delay in terms of 1+ bars could be an unrealistically large amount.
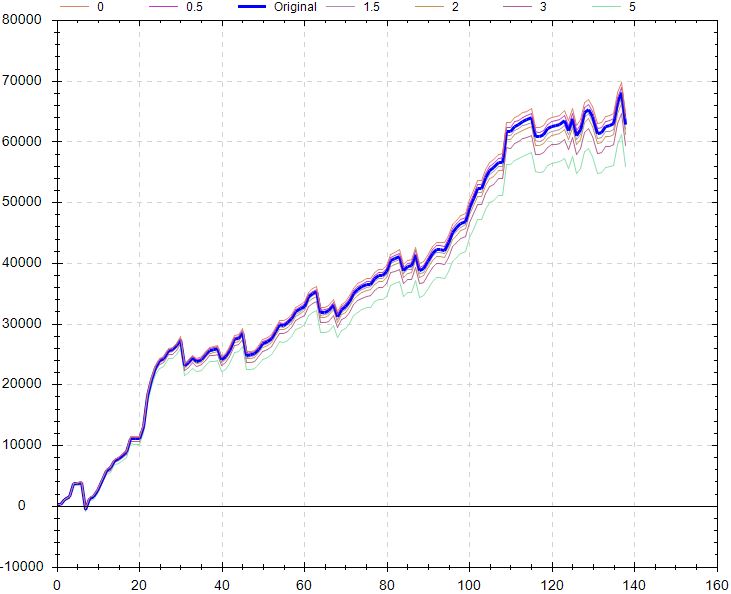
Factoring in worse execution might be more relevant and along these lines, the slippage test looks better:
Like the delay test, the liquidity test looks poor (my notes Screenshot 16), but I would pose the same questions. If profitable trades are being held for one day and entry is delayed by a large part of that period, then most of the profit potential evaporates immediately. Significantly poorer performance would be no surprise.
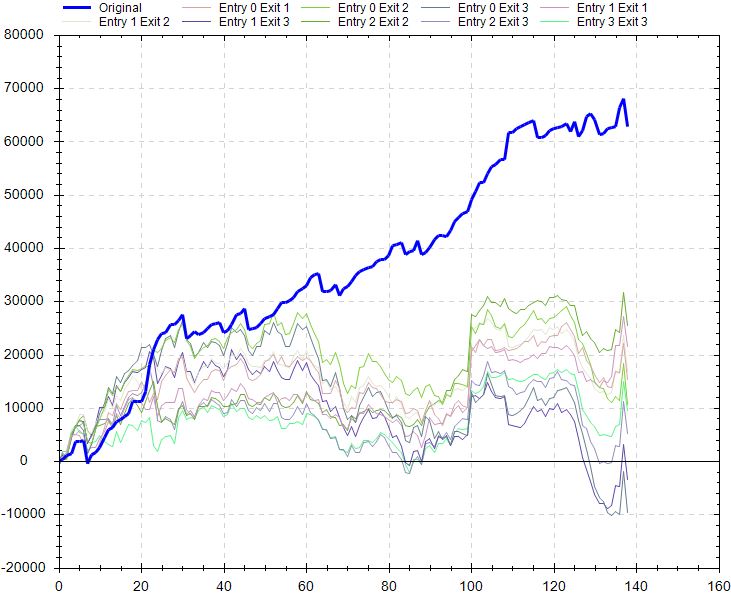
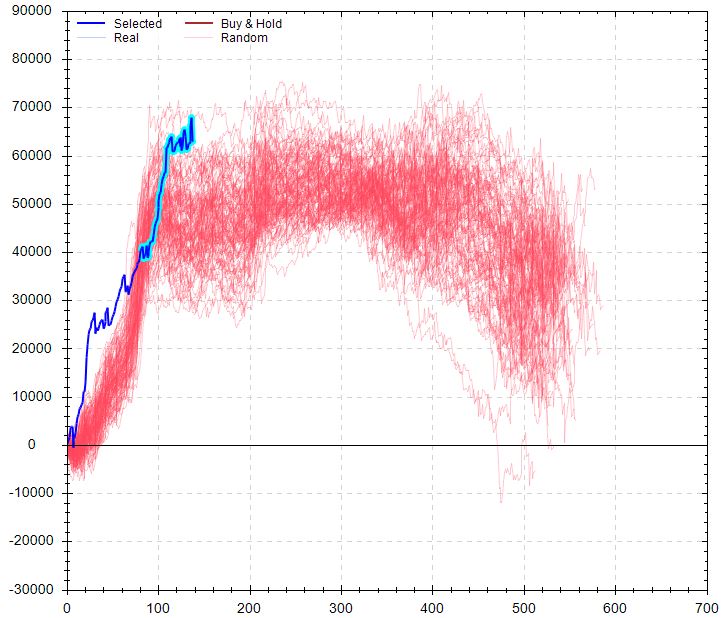
The noise test looks poor:
I included up to 25% noise here for OHLC. The actual backtest is pretty much the best equity curve on the graph. At least all the other simulations are profitable, but this suggests I shouldn’t necessarily expect such good performance if traded live.
For me, the second paragraph above especially resonates with something like the noise test. I would think altering the data series in this way would dramatically worsen any trading strategy that is better than random. I expect to better understand the importance and variety of noise test results as I get closer to studying a large sample size of strategies.
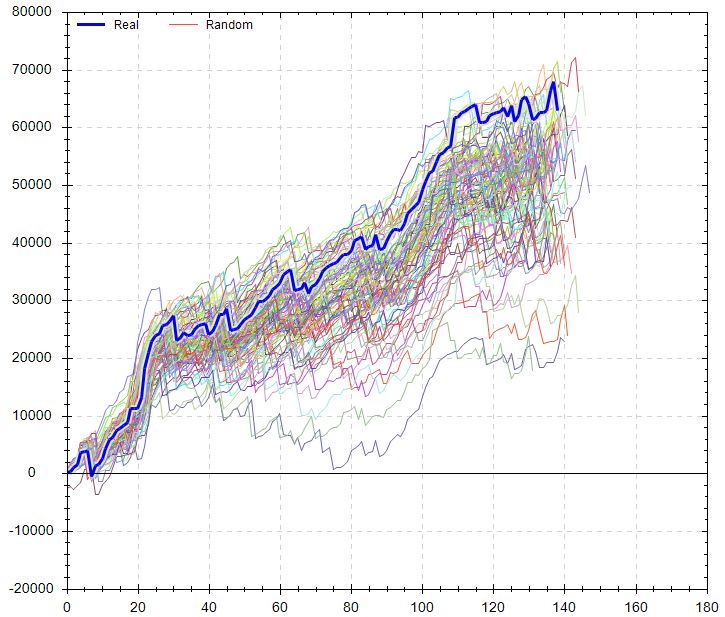
Randomized OS graph looks encouraging:
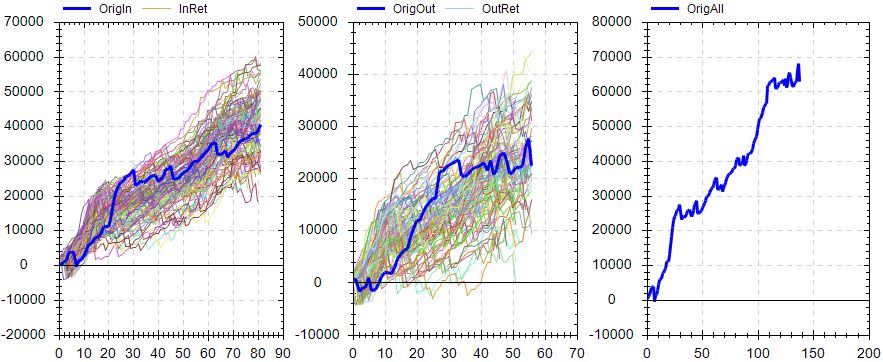
On the OS graph, the actual equity curve is right in the middle of the randomized simulations.
Overall, my initial impression is cautiously optimistic with this strategy. The OS curve looks solid. Performance versus random is solid. Monte Carlo is solid. MFE/MAE looks solid. Slippage test looks solid. The variance test seems pretty solid. Delay, liquidity, and noise tests don’t look so great. The randomized OS simulation looks ideal.
Further directions could include:
- Modifying the simulation dates
- Modifying [canned] exit criteria
- Toggling OS between beginning/end
- Changing fitness function
- Verifying the backtest in TS and studying performance report
- Checking on unseen data (i.e. incubation)
Another exploration would be to vary OS percentage with a caveat. While I think varying OS % may get me different strategies, with a minimum number of trades required, increasing OS % will exclude otherwise-qualifying strategies.
Random Simulation 1 (Part 1)
Posted by Mark on June 19, 2020 at 15:44 | Last modified: May 22, 2020 10:22As I enter the second stage of what I hope will be a long career in trading system development, this is my documentation of steps taken and my software learning process.
As a first attempt, I selected a desired market and direction along with random symbols (my notes Screenshot 1). I selected exit criteria as shown (Screenshot 2). I made sure to select at least 50 trades each and I selected 50% in-sample data. I entered max holding time (range with increment 5) and profitable closes (range with increment 2). I entered transaction fees (charge) and max number of two rules to minimize processing time.
Once the simulation had run, I was left with 500 strategies (Screenshot 3). The fitness results were eye-popping until I realized that I was looking at IS results.
I toggled to “both” (OS too) and turned on the equity curve thumbprint. I started scrolling down the list in search of good OS performance. This would be a curve that roughly matches IS performance, slopes flat/up, and does not have any large drawdowns. I was able to dismiss most strategies very quickly. When I later sorted OS results, I found only a few strategies that were even profitable (no wonder most curves looked poor!).
Then I got to #482:
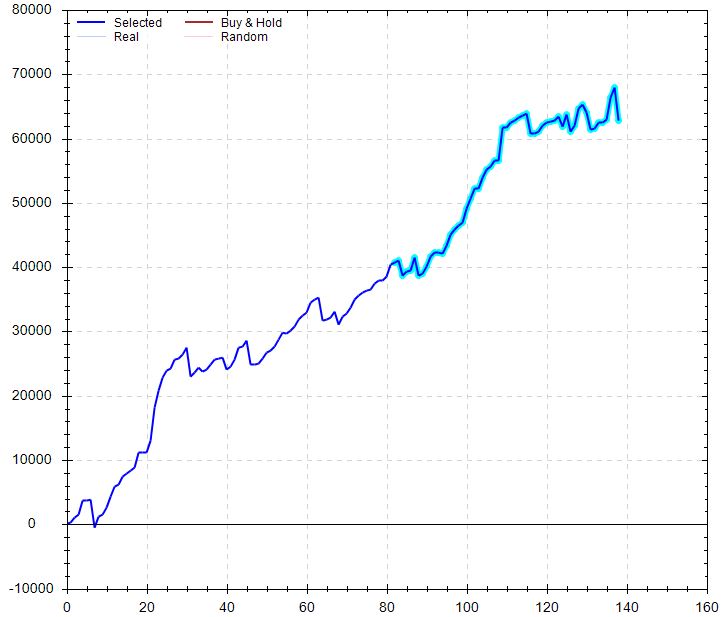
Performance was astounding versus B&H. Performance was pretty good versus random, too:
MFE/MAE looked really strong for days:
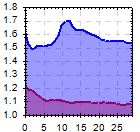
Lowering win rate by up to 10% and simulating 100 trades x1000:
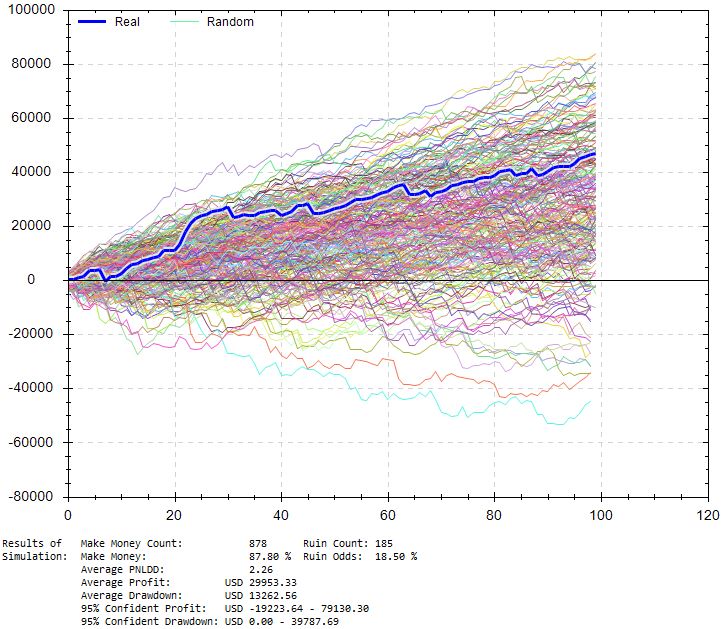
This shows an 18.5% chance of losing $10,000 with ~5% of drawdowns exceeding $40K. Average drawdown is just over $13K compared to $5,200 for the original backtest. PnL/DD remains over 2, which seems pretty solid. I could base position sizing off this, but being stressed conditions I don’t have context for reliability. In other words, I will run this test on all strategies but the amount of stress may differ depending on win rate, the impact of stressing may differ across strategies, etc.
I will continue next time.
Categories: System Development | Comments (0) | PermalinkWorst Drawdown is Always Ahead
Posted by Mark on May 8, 2020 at 07:12 | Last modified: May 6, 2020 13:23Today I want to explain and provide a caveat to the claim “backtesting fails because my worst drawdown is always ahead.” *
Regardless of backtesitng interval, future market conditions can always be worse than historical. The only case where this would not be true is one where the underlying goes to zero. Were that to happen, of course, the underlying would not be tradeable today.
The worst drawdown being ahead is a consideration to be made in trading system development rather than a failure of said development. Backtesting is a phase of trading system development. Monte Carlo simulation might be another phase… position sizing yet another. The latter two can potentially offer better perspective on likely worst-case future drawdowns based on historical backtrades.
Any systematic approach to trading is based on backtesting and live-trading experience. Nevertheless, drawdown is always a nervous time. The deeper the drawdown, the fewer similar occurrences to anything seen in the past. This gives rise to uncertainty at the right edge of the chart. I can hold through a -10%, -25%, etc. correction and say “well this has only happened X, Y, etc. times in the last 15 years,” but to then believe this can in any way forecast a market turnaround is flawed. The chance of Tails on the next coin flip is 50% regardless of how many consecutive Heads have just turned up.
I like the idea of position sizing based on historical drawdowns plus additional margin of error in case of a worse-case future drawdown. Ultimately, though, I am always just crossing my fingers for a reversal in fortune. A drawdown 50% worse than 2008 is enormous and can certainly come to pass. The deeper a correction becomes, the more I will be hoping the Big One is not taking place now.
Two things can benefit me in the unlikely case the worst drawdown in history is in progress. First is the alluring case for insurance. Second is trading with constant position size because the profits already generated can then serve to offset drawdowns proportionally. Other position sizing algorithms will be position sized largest at portfolio highs, which can lead to the largest gross losses.
* — This post was written in May 2016 but never completed. I find this interesting
to revisit in lieu of my recent algorithmic trading experience.
Trading System Development 101 (Appendix B)
Posted by Mark on April 6, 2020 at 06:51 | Last modified: May 15, 2020 14:46This year, I have been trying to get more organized by completing rough drafts into finished blog posts. Sometimes I don’t even understand what I have written because it has been so long, but I am presenting them anyway on the off chance someone out there can possibly benefit. In that vein, here are the last loose ends and notes regarding my mini-series Trading System Development 101 (concluded here).
—————————
From the last paragraph here, I could also look at what percentage of iterations are profitable when grouped by VIX cutoff value. I could then know how often a VIX filter would actually work and whether I get those desirable high plateau regions.
This post had a footnote where I indicated some further explanation could be useful. Looking back to that final full paragraph, imagine one set of trendlines might result in X, Y, and Z trades being taken. Were the chart to begin a couple bars later, imagine a different set of trendlines could result in A, B, and C trades being taken. Granted, multiple trendlines generated due to the allowable margin of error are better than zero or few trades (sample size too small). Both sets of trades are equally feasible, though, and should therefore be considered even though multiple open positions are not allowed in backtesting. Timing luck applies here to the trades themselves, as well as the trendlines with respect to where the chart begins and what bars will be available from which to construct trendlines.
The last loose thread I wish to tackle is from the final paragraph here: why is KD’s most common response to me “there is no right or wrong answer?”
This is an example of a standard response I get:
> It could be hurting, hard to say for sure. Try aiming
> for 100-200… a few times and see what happens. Or
> even try 1000 or more. There are some who usually do
> 10 or less, some that keep it under 100, and some that
> always have thousands. So, there is no set answer to
> this, because all can work (and all sometimes don’t).
This almost sounds like Yogi Berra wisdom!
My response is:
> You say there’s no correct answer, but it may be an
> empirical question. You could track the lifetime of
> viable strategies (how long until they break). You
> could then look at strategies with few and compare to
> strategies with lots. Track how long until they break.
> Compare the two groups to see which is longer.
He certainly could do this and I think it would be quite insightful.
However, recall his business model I detailed in the second paragraph here. Anything tested by others are strategies he doesn’t have to test himself. He will never know what everyone tests, but the more strategies tested by others, the more viable strategies will be passed to him. The more diversity in strategies tested by others, too, the more noncorrelation he can realize. The last thing he’d want to receive are strategies similar in one or more ways.
Discouragement of any kind is therefore not in his best interest. Whether it has few or many iterations, optimizes over this or that range, uses this time frame or that one, is mean-reverting or trend-following, etc., as long as it passes his criteria, it’s a strategy he will be very eager to check and/or implement for himself.
Categories: System Development | Comments (0) | PermalinkTrading System Development 101 (Appendix A)
Posted by Mark on April 3, 2020 at 10:42 | Last modified: May 15, 2020 14:14This year, I’ve been trying to get more organized by turning rough drafts into finished blog posts. Sometimes, I don’t even understand what I have written [long ago] in the drafts, but I am presenting them anyway on the off chance that someone out there can benefit. In that vein, I have a number of loose ends and notes regarding my mini-series Trading System Development 101 (concluded here) and related posts that will occupy two further entries.
—————————
When choosing fitness functions, we need to understand how they can possibly deceive. For example, a profit factor of 2.0 may be $5,000 (if it makes $10K and loses $5K) or $50,000 (if it makes $100K and loses $50K). Also, average trade is not per day; $1,000 for a trade held for five days is more attractive than 50 or 500 days.
With regard to my brief experience thus far testing algorithmic strategies, I’m shocked to discover almost nothing works! This is despite all those books with chapters on indicators, all the instructional webinars, and all the educational programs alleging to teach technical analysis. Hardly anything that claims to work is backed by supporting data, either.
With the exception of equities, I have gotten the impression that money is much easier lost than gained. Making money in non-equity markets seems to require a behemoth effort.* With equities, almost everything makes money when bought. Problematic are the occasional sudden, fast, hard corrections and bear markets that wipe out much of the gains in a short period of time. This is no big deal for long-term investors who don’t often look at the market and hold positions for years. For traders who try to profit consistently over the shorter term, this can pose major psychological challenges.
To reiterate a point made near the end of this post, finding a viable trading strategy is probably not about reading an article or chapter on a TA indicator and using it as prescribed. The answer is not to attend an online webinar and implement said strategy verbatim in my live account. Most things I will test will not work; it’s not nearly as easy as the presenters make it sound. The most important thing is a well-thought-out development process and boatloads of patience and motivation.
Going back to this blog mini-series, here’s a note on over-optimization (i.e. overfitting):
> Though not specific to automated trading systems, traders
> who employ backtesting techniques can create systems that
> look great on paper and perform terribly in a live market.
> Over-optimization refers to excessive curve fitting that
> produces a trading plan unreliable in live trading. It is
> possible, for example, to tweak a strategy to achieve
> exceptional results on the historical data on which it was
> tested. Traders sometimes incorrectly assume a trading
> plan should have close to 100% profitable trades or
> should never experience a drawdown to be a viable plan.
> As such, parameters can be adjusted to create a “near
> perfect” plan — that completely fails as soon as it is
> applied to a live market.
I will conclude next time.
* — Most of my testing thus far has been of symmetric strategies: opposite rules for buy and sell short.
General Theories on System Development (Part 2)
Posted by Mark on January 30, 2020 at 10:01 | Last modified: May 1, 2020 13:34Today I present the conclusion to a two-part series written on December 5, 2012, where I discuss another issue for debate regarding the philosophy of trading system development.
In my last post, I discussed one of two general approaches to system development where I test multiple trading rules on just one ticker. The second approach flips the first on its head: backtest one trading rule on multiple tickers in search of the ticker(s) that generates widespread and consistent profit.
The statistical caveat I had regarding the first approach also applies here. If I test enough tickers on any given trading rule, then some tickers will show significant profits just by chance alone (e.g. one in 100 at the 0.01 level of significance). In case of the latter, profitable backtesting results are unlikely to be realized in live trading.
Caveat aside, I find this second approach persuasive because of this:
> Why should long-only trades outperform for S&P 500 and Nasdaq stocks but not
> small caps? I’m sure imaginative types could come up with potential explanations
> but it makes me skeptical about the pattern since they’re all broad-based indices.
This implies a common human psychology underlying all trading behavior. If this is true, then consistency across broad-based stock indices should follow. At best, this consequence seems less likely than to say different stocks have their own personalities for finite periods of time (see fourth paragraph). At worst, the consequence seems downright preposterous.
Today in 2020, I still see logical reason to support both approaches.
For the sake of trading system development, the second approach is a higher hurdle to clear because it requires a strategy to perform well on multiple markets. I think the second approach also begs the question how often and for how long do viable strategies work well for multiple markets and then stop working for some? This seems to be getting meta-meta-complicated compared to “for how long do viable strategies proceed to work?”
The gestalt of everything I have seen, read, and traded over the last 12 years leads me to favor the first approach. I would feel very comfortable with a strategy that works on one ticker but not others inside or outside the same asset class were it able to pass either the walk-forward (Part 1 through Part 4) or data-mining approach to system development.
If I had to grab for some supporting evidence in a pinch, then it would probably be correlation. Commodity trading advisors commonly seek to trade a diversified basket of futures markets to compile a low-to-slightly-negative overall correlation. To think a single strategy should work on these relatively uncorrelated components seems almost like a contradiction in terms.
These are two interesting approaches/theories, tough to sort through, and very much subject to personal preference.
Categories: System Development | Comments (0) | PermalinkGeneral Theories on System Development (Part 1)
Posted by Mark on January 27, 2020 at 06:03 | Last modified: May 1, 2020 09:44I have a lot of loose ends in this blog. Some of them you see (most recently here). Some of them, which take the form of unpublished drafts, you don’t. What follows (italicized) are unpublished drafts from December 2012. I thought these might be especially interesting to revisit in the midst of my recent algorithmic trading experience.
In this post, long-only outperformance seen with SPY and QQQ did not hold with IWM. Because I approach system development with a healthy dose of critical analysis [this hasn’t changed!], I tend to question whether the pattern is real when I see something that selectively applies. This suggests two different approaches to system development.
Let me point out one nuance about terminology. More recently, I have been using “approach” to describe the how of trading system development: walk forward (Part 1 through Part 4) or data mining. With the 2012 posts, “approach” pertains to the what of trading system development: one or multiple markets being tested (using either walk forward or data mining, presumably). Hopefully that allays any potential confusion.
The first approach is to backtest many trading rules [or strategies as I call them in 2020] on one ticker in search of the trading rule(s) that generates widespread and consistent profits when being used to trade that ticker. This approach implies that different tickers have different personalities. This may be a reflection of what technical analysis is being used by the largest institutions involved. For example, suppose institutions accounting for 60% of a ticker’s volume use MACD signals. I could then expect MACD strategies to work well with said ticker.
This system development approach explains why systems break. Systems are known for working—until they don’t. If different institutions or fund managers start trading a particular issue, then strategies that previously worked may cease to do so…
…if I test enough rules on any given ticker then some rules will show significant profits just by chance alone (e.g. one in 100 at the 0.01 level of significance). How do I know if I have stumbled upon a true gem or a chance finding? In case of the latter, profitable results seen in backtesting are unlikely to persist into the future.
This final point is a caution not to buy into the theory too heavily. I can never prove institutions are responsible for a strategy that works. I should never be so confident in that belief that I stop monitoring for signs of a broken system.
Next time, I will discuss an alternative theory about trading systems.
Categories: System Development | Comments (0) | PermalinkTrading System Development 101 (Part 8)
Posted by Mark on January 24, 2020 at 07:42 | Last modified: April 30, 2020 11:47Last time, I introduced a data-mining approach to trading system development.
To summarize, here are the three steps to developing strategies the data-mining way:
- Select: market(s) and test dates, entry signals, exit criteria, and fitness function
- Run simulation to create strategies
- View resultant strategies, stress test, forward simulate, create portfolios, check correlations, print tradeable code
Although this approach to strategy development does not require me to provide strategies, I am already anticipating an organizational nightmare. The simulations take time (proportional to complexity) and I don’t want any duplicates.
I need to come up with a system to label and track simulations. Each simulation will have entry/exit signals, profit targets, stop-loss, additional exit criteria, designated markets, direction, fitness function, number of trading rules, etc. Many of these selections are mutually exclusive (ME) and will require separate simulations. For example, different fitness functions are going to result in different strategies. I hope number of rules is ME. If not and selecting X rules means < X rather than X and only X, then I will have to give this one more thought. Long versus short is ME and will require a separate simulation.
The software also has other features that will give rise to additional simulations in need of organization. Minimum number of OS trades and/or percentage of total data allocated to OS can vary and give rise to different strategies. The software allows for intermarket signals, which at this point I have no idea how to categorize or test. I can say the same for ensemble strategies, which take positions only when designated combinations of other strategies have done the same.
Although the software creates strategies automatically, the rest has to be done manually. I can’t enter fitness criteria, which means I will have to sort on that based on pre-determined critical values. I will then have to run and eye the stress tests independently. Each stress test will probably give rise to an accept/reject decision. Any reject decision may be reason to move on to the next one. I’ll know more as I get into actual work with the software. In either case, I may want to document what stress tests were done and how they fared: more aspects of this grand organizational feat.
Categories: System Development | Comments (0) | Permalink