Random Simulation 1 (Part 1)
Posted by Mark on June 19, 2020 at 15:44 | Last modified: May 22, 2020 10:22As I enter the second stage of what I hope will be a long career in trading system development, this is my documentation of steps taken and my software learning process.
As a first attempt, I selected a desired market and direction along with random symbols (my notes Screenshot 1). I selected exit criteria as shown (Screenshot 2). I made sure to select at least 50 trades each and I selected 50% in-sample data. I entered max holding time (range with increment 5) and profitable closes (range with increment 2). I entered transaction fees (charge) and max number of two rules to minimize processing time.
Once the simulation had run, I was left with 500 strategies (Screenshot 3). The fitness results were eye-popping until I realized that I was looking at IS results.
I toggled to “both” (OS too) and turned on the equity curve thumbprint. I started scrolling down the list in search of good OS performance. This would be a curve that roughly matches IS performance, slopes flat/up, and does not have any large drawdowns. I was able to dismiss most strategies very quickly. When I later sorted OS results, I found only a few strategies that were even profitable (no wonder most curves looked poor!).
Then I got to #482:
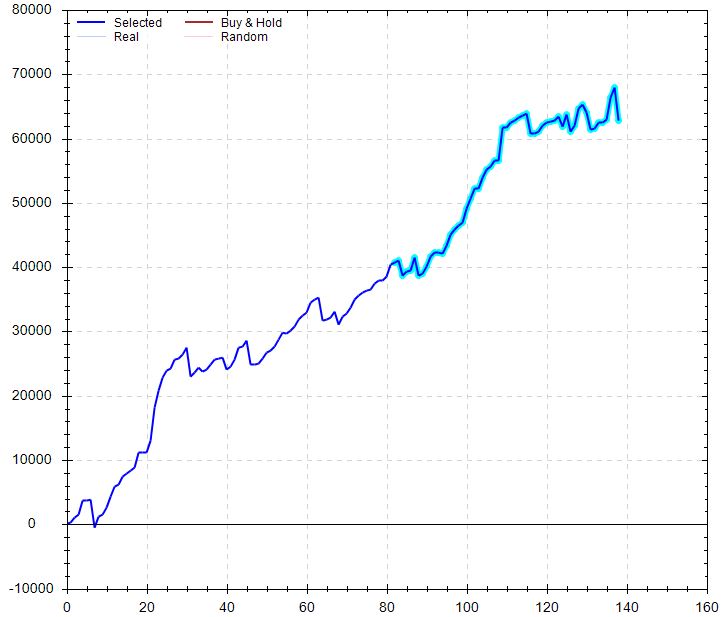
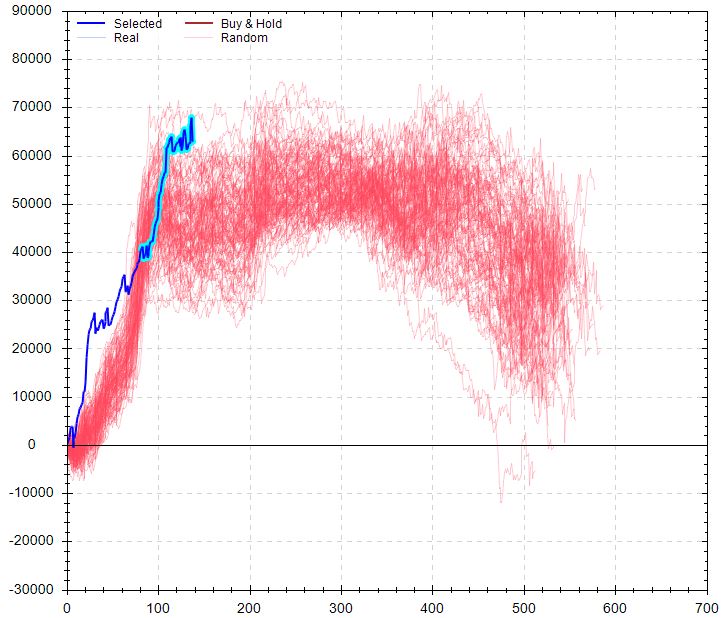
Performance was astounding versus B&H. Performance was pretty good versus random, too:
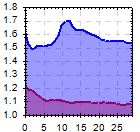
MFE/MAE looked really strong for days:
Lowering win rate by up to 10% and simulating 100 trades x1000:
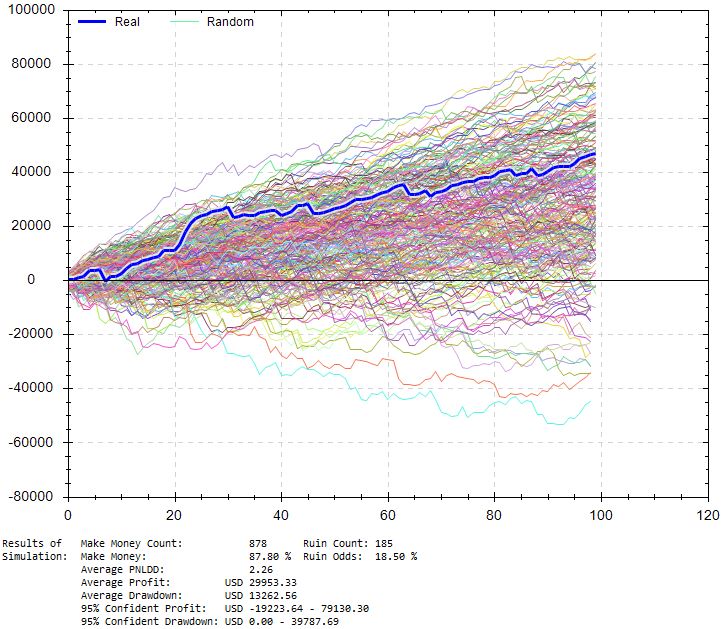
This shows an 18.5% chance of losing $10,000 with ~5% of drawdowns exceeding $40K. Average drawdown is just over $13K compared to $5,200 for the original backtest. PnL/DD remains over 2, which seems pretty solid. I could base position sizing off this, but being stressed conditions I don’t have context for reliability. In other words, I will run this test on all strategies but the amount of stress may differ depending on win rate, the impact of stressing may differ across strategies, etc.
I will continue next time.