Worst of Naked Puts for 2020 (Part 2)
Posted by Mark on July 28, 2020 at 06:44 | Last modified: July 12, 2021 12:41Last time, I presented some manual backtesting in OptionNet Explorer selling the most inopportune monthly naked puts ~120 DTE in Feb 2020. Today I continue with more analysis, which actually takes the form of an e-mail sent to a colleague (and will therefore remain largely unchanged).
I do think this is cherry-picking the absolute worst, but you think even the absolute worst should be heeded because the market will eventually find it. Had you started a few weeks earlier or been running this campaign for several months, you would be net long puts and perhaps completely fine.
What comes next, though?
In 30 days, the market is down 950 points, which is 28%. Certainly once IV has spiked, the losses on subsequent NPs won’t be as big—but still significant. I once sold some NPs with a 3x SL. The worst in the current backtest is down 75x. That’s a wide swath for tremendous devastation: 65x, 55x, 45x, 35x, 25x, 15x, 5x, etc. Anything sold during this time is going to lose big money, which you somehow have to manage.
If you stayed out and sold no new NPs (trade guidelines needed), then when would you get back in?
And once you get back in, it’s going to take some time for those to mature and get converted to net long puts. Only then can you start placing income structures. Won’t you be starting back again at just one contract, no matter how large your account had grown and what the average annual monthly target is? Maybe it would be one tranche and the number of contracts per tranche would grow as your account grows. I’m not sure, but in any case it would be one when you’re used to having on several. What would be your guidelines to “resume” the portfolio?
On the plus side, any income structures placed in March would be in higher-IV conditions thus more resilient anyway. Might these not need a tail hedge (or would they automatically include one per the dynamic-sizer spreadsheet)? Actually, that’s a whole different structure than the tail hedge; let’s not mix multiple trading plans at once.
I can imagine a rudimentary trend-following strategy keeping you out of much of the downdraft, but I still have the same concern as explained two paragraphs above. The factory gets disrupted if you’re out for much longer than it usually takes to generate new hedges. You will eventually go from a steady state average to a lower number of hedges, which somehow means you have to decrease position size of otherwise unprotected income generators.
Maybe this is a “first-world problem” because it merely implies lower profit. The opportunity cost concern is exactly what leads some traders to size too large, though, when can later result in catastrophic loss.
Categories: Backtesting | Comments (0) | PermalinkWorst of Naked Puts for 2020 (Part 1)
Posted by Mark on July 23, 2020 at 17:12 | Last modified: July 12, 2021 12:01I’ve been revisiting the idea of naked puts (NP) and did some backtesting of Feb-Mar 2020, which is when the most recent market crash hit hardest.
I actually composed this as an e-mail to someone and I’m going to leave it largely unchanged. Trade management dictates rolling down and out with unspecified parameters. Being unspecified, I just allude to the roll in a general fashion.
Here’s the worst for 2020: 12 Jun 2425 NPs sold for $4.30 on 2/19/20 (121 DTE) with SPX at 3387.41 and Avg IV 11.49.
On 2/24/20, with SPX at 3229.63 (Avg IV 21.78) the NP is $11.05. Would you roll with the strike at 2425? If so, then you could roll down 75 points and out one month for a credit. Thereafter, you can’t roll down more than 50 points for a credit.
On 3/16/20 (95 DTE), NP is ITM and $317.90 with SPX 2409.18 (Avg IV 78.49). For a credit, you can roll out one month and down 25 points. You could also roll out two months and down 50 points for a credit.
On 3/18/20 (93 DTE), NP is ITM and $326.90 with SPX 2382.30 (Avg IV 74.65). For a credit, you can roll out one month and down 25 points. You could also roll out two months and down 75 points for a credit. It’s hard to imagine execution, though. OI exists, but the options are very expensive. In normal markets, $0.05 slippage on $5.00 is 1%. Here, 1% is ~$3.25. Compound that with market crash conditions…
On 3/19/20 (92 DTE), NP is ITM and $275.90 with SPX 2409.63 (Avg IV 68.98). For a credit, you can roll out one month and down 50 points. You could also roll out two months and down 75 points for a credit (not with the lousy execution, though).
On 3/20/20 (91 DTE), NP is ITM and $293.25 with SPX 2309.66 (Avg IV 62.48). For a credit, you can roll out one month and down 25 points. You could also roll out two months and down 75 points for a credit (not with the lousy execution, though).
On 3/23/20 (88 DTE), NP is ITM and $285.55 with SPX 2253.66 (Avg IV 60.94). For a credit, you can roll out one month and down 25 points. You could also roll out two months and down 50 points for a credit (not with the lousy execution, though).
On 4/1/20 (79 DTE), NP is ITM and $193.05 with SPX 2472.64 (Avg IV 56.08). For a credit, you can roll out one month and down 50 points. You could also roll out two months and down 100 points for a credit (not with the lousy execution, though).
It gets better after that, but any of these losses are horrendous. Even 4/1/20 is 44x the initial credit, and this doesn’t even account for the fear level of trying to roll in these market conditions. On 3/18/20, the original 12 NPs would be down $387K.
I will continue next time.
Categories: Backtesting | Comments (0) | PermalinkStepping Back to Walking Forward (Part 1)
Posted by Mark on July 20, 2020 at 07:08 | Last modified: June 30, 2020 14:41Reflecting on recent studies, I’m starting to see a bridge between data mining and walk-forward (WF) optimization.
Let me begin by discussing the assumption that all trading systems break. I will not be able to verify this myself until I have developed a respectable sample size of viable strategies [I have zero thus far] with further data on strategy lifetimes. Nevertheless, many gurus talk about continuous system monitoring in case of breakage. Many traders mention it, too.
One explanation for the poor performance I have seen in recent studies (see third-to-last paragraph here) could be that the incubation period is too long. I’ve been testing good-looking strategies over a subsequent four-year period. What if the average lifetime of a profitable strategy is six months? Averaging over four years when real outperformance may be limited to six months could result in overall mediocrity.
Recall my discussion in this second- and third-to-last paragraph where I suggested the most important feature of strategy performance might be a maximal number of profitable runs over the complete backtesting period. This echoes WF with the exception of reoptimizing parameter values: here I want to stick with one constant strategy all the way through.
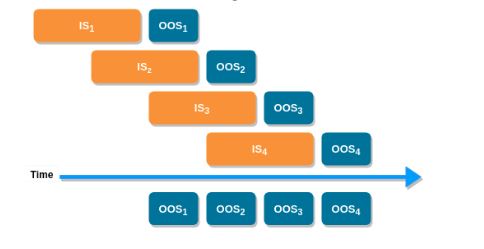
A shorter average strategy lifetime means validation or incubation should be tested over shorter time intervals. The WF process seems perfectly suited for this: test over relatively brief OOS periods, slide the IS + OS window forward by those brief increments, and concatenate OOS performance from each run to get a longer OOS equity curve. I like the following image to illustrate the concept:
I started to describe the data-mining approach to trading system development with regard to how it diverges from the WF process here. I feel I may now have come full circle albeit with the one slight modification.
As I struggle to rationalize the Part 7 results (first link from above), I can shorten the incubation period or leave it unchanged in subsequent studies.
Perhaps I am suggesting a new fitness function altogether: percentage of OOS runs profitable.
Backtracking a bit, I think much of this evolved because I have yet to see validation data for the different stress tests. Such data is not forthcoming from the product developer who says in a training video, “at the end of the day, we are still competitors and I have to keep some things to myself.” This is data I will have to generate on my own.
Categories: System Development | Comments (0) | PermalinkMining for Trading Strategies (Part 7)
Posted by Mark on July 17, 2020 at 07:20 | Last modified: June 27, 2020 14:35Although my next study aimed to correct the mistake I made with the previous [long] study, I accidentally mined for short strategies. This was illuminating—as described in these final three paragraphs—but did not address the comparison I really wanted to make (see Part 6, sixth paragraph).
Given the fortuitous discovery I made from that short study, though, I proceeded to repeat the long study by switching around IS and OOS periods. I trained strategies on 2007-2011 and incubated from 2015-2019. I tested only 4-rule strategies expecting to find worse performance due to an inability to effectively filter on regime [which may have taken place in the previous study]:

Results are mixed. Beginning outperforms on Net PNL and Avg. Trade. End outperforms on PNLDD and PF. None of these differences are statistically significant.
This does not seem to be consistent with my theory about mutually exclusive regimes. That would be one regime controlling 2007-2011, a different regime controlling 2011-2015, and just one ruling 2015-2019.
In the face of a persistent long bias, such regimes would not exist: long strategies would be profitable whereas short strategies would not. As a general statement, this is true. Looking more closely, however, it certainly is not. 2007-2009 included a huge bear (benefiting shorts) while 2009 to (pick any subsequent year) benefits long strategies.
And if it’s tough to figure out equity regimes, then good luck finding anything of a related sort when it comes to CL or GC where words like “trend” and “mean reversion” don’t even begin to matter (based on my testing thus far).
Where to go from here?
- I should repeat the last study with 2-rule strategies to make sure I don’t get any significant differences there either.
- I could require a regime filter for the 4-rule strategies just in case none/few have been implemented.
- I need to better understand the short strategies. It’s one thing to find strategies that pass IS and OOS. It seems to be quite another to find strategies that do well on a subsequent OOS2. Performing well in OOS2 is what ultimately matters.
I have one other troubling observation to mention. Although the long strategies in all three studies (including that from Part 5) incubated profitably on average, performance does not begin to approach what we might require from OOS in any viable trading strategy. I did see flashes of brilliance among the 4-rule strategies (6, 9, and 10 strategies for each of three long studies posted PNLDD over 2.0 with a few excursions to 6 and one over 14!). On average, though, 203 top long strategies over eight years averaged a PF ~1.21 and PNLDD ~0.8 over four years to follow of a consensus bull market.
And don’t forget that we don’t have context around the 1.21/0.8 without comparable numbers for long entries matched for trade duration (Part 6, sixth paragraph).
Forget all the pretty pictures (see second paragraph here); if this is an accurate representation of algorithmic trading then those who say you’re not going to get rich trading equities certainly weren’t kidding!
Categories: System Development | Comments (0) | PermalinkWhat Percentage of New Traders Fail? (Part 5)
Posted by Mark on July 14, 2020 at 06:13 | Last modified: May 17, 2020 13:14Today I continue with excerpts from a Forex website forum discussion in 2013. The initial post, which tries to rebuke traditional wisdom, is Post #1 here. Forum content is unscientific and open to scrutiny. Do your own due diligence and buyer beware.
—————————
• Post #47, 4xp
> The simple fact is that more traders have to lose than win
> in order for the winners to make money… we are able to
> have leverage because of so many losers in the market.
> IMO, I believe the number is closer to 90% failure rate
> than 99% that many have already espoused.
>
> The reason forums like this one are so popular is because
> there are so many losers. Most people are not making any
> money trading, so they come here looking for and hoping to
> find something they can learn from. By the time you get
> here, you have the blind leading the blind. Many admit
> they are newbies or learning. Others want to pose as
> experienced traders because of an oversize ego, but they
> are really losers. Others come here because they have a
> web site, but they do not know how to trade, so they
> beguile newbies to head to their site. When it is all said
> said and done, it can be hard to discern the very few that
> are good traders because they are hiding behind the guise
> of their computer screen.
>
> When someone says you cannot beat the market, that is all
> rubbish. The reason the ~10% beat the markets is they are
> armed with and trade their methodology so they can beat
> the markets. The few that win consistently take personal
> responsibility for their actions rather than blaming the
> markets. The markets can only go up or down. You just
> have to have a methodology that discerns which direction
> it is going then jump on board.
>
> It is also no such thing that the markets are a zero-sum
> game. All of us can be winners, or all of us can be losers.
> I don’t concern myself with newbies coming up through the
> ranks becoming winners and then rob my pot. No chance!
Lots of good ideas here! Some are speculation (e.g. paragraphs 1 and 4), but they are interesting nonetheless.
In another post, 4xp goes on to write:
> People lose because they do not take time to learn. When
> I first started in 2004, I was working in a factory. I’d
> get home, then start learning about the markets. It took
> much experimentation and labor. I failed many times. Was
> it worth it! Well, let’s see. I wake up in the morning,
> go through my morning routine, which includes some quiet
> time and a trip to the coffee pot, then I make the long
> walk down the hallway to my home office, and report to
> work. Ahh, yes. It was worth it.
>
> Simply put, if you were training to be a doctor, you
> would have to go to school for 8 years, and pay all that
> money. Here, it depends on your learning curve and does
> not have to cost what a doctor pays. When you are
> finished and ready to enter the markets, you make more
> than the average doctor. But, yes, it take work and
> lots of time.
Five stars on the first paragraph!
With regard to the second paragraph, I disagree with making more than the average doctor. Not only does 4xp suggest it’s guaranteed, whether it’s even possible is highly dependent on starting capital level.
To be continued…
Categories: Financial Literacy | Comments (0) | PermalinkStability
Posted by Mark on July 9, 2020 at 07:06 | Last modified: May 11, 2020 14:01Continuing on with my year-long organization project, this is an unfinished draft from January 2019 on stability.
—————————
The extent to which stability seems to be left out of trading system development is alarming.
I worry that lack of [a] stability [derivative] has the potential to disrupt the entire backtesting endeavor. “Past performance is no guarantee of future returns” may be a microcosm of everything I am to say below.
Trading system development often looks at a large sample size of trades and gives averages. One problem with looking at the average across a large time interval is that the local averages at different points within the whole interval may vary greatly. Suppose I find the average ATR is 15. That doesn’t tell me whether 80% of occurrences are at 15 or whether 2% of occurrences are at 15 with 49% each at 5 and 25. Huge difference!
If I use a VIX filter and say “bad things happened with VIX over 30” but this only happened 60 of 4000+ times and most were in 2008 (third paragraph here), then have I added a robust guideline or simply one that is curve fit to the past (i.e. based on something that is unlikely to repeat)? I think one benefit of walk-forward is that by training over the recent past, I won’t get locked into using values that may be historic extremes and cherry-picked over a long period of time. For example, the long-term average for VIX may be 16-18 but in 2017 we went the whole year without seeing 12 and for at least a couple years we only rarely got over that LT average.
Therefore, anytime I’m going to look at historic data and determine a critical value, I need to look at frequency of that value and the distribution of those instances. If I could eliminate the losses of Feb 2018 then it might make for meaningful portfolio performance. However, if Feb 2018 were the only time such an event occurred, then I’m entering into a behavior pattern whereby I insure myself against any unique past event ever seen. This is like mummifying a corpse by placing paper mache over every single square inch of flesh (see third paragraph here) to eliminate exposure. In the end, this is either the Holy Grail (reward without risk) or a flat position (no risk, no reward). I can’t expect to have everything covered.
Rolling averages are a means to assess stability. If I have 16 years of data then an average over the entire 16 years may not be very meaningful. Taking 3-year rolling averages, though, and then looking at what percentage of the 14 rolling periods generate a return in excess of X%, for example, is a better way to describe the whole. The distribution is also important: by percentage return and by date. I don’t want to see anything to suggest the system is broken (e.g. all winners in the first eight years and all losers in the last eight).
Stability also matters with regard to correlation. Correlation is used as support for particular strategies (e.g. intermarket) or creating multi-strategy portfolios. Correlations change, though. I think it would be useful to plot rolling correlations to better understand whether it makes any sense to report static correlations or whether they fluctuate enough to be meaningless.
Categories: System Development | Comments (0) | PermalinkThe Mixed-Up Files of SEMI Collective (Part 2)
Posted by Mark on July 6, 2020 at 07:15 | Last modified: May 7, 2020 15:34I’ve been going through my “drafts” folder this year trying to finish partially-written blog posts and get more organized. This is another series of unfinished posts.
From October 2016, I have a post about the SEMI group concept. I also had four other incomplete drafts. I have cursorily looked over these drafts along with the actual post. The content is different.
This particular draft is from October 14, 2016, and has 20 revisions. I therefore worked quite a bit without ever getting it done! I resurrected Part 1 here. In the longshot case that someone out there could possibly benefit from any of this, here is what I believe to be Part 2.
———————————-
What can you expect to get out of this group?
If you are a beginner then you should get a solid financial foundation on which trading strategies can be built. I have a good idea about what gets taught in premium courses. My presentation material would overlap and this can serve as a good starting point. I say “starting point” because to be successful, I believe you must always do the work of tailoring any strategy to your own individual personality.
If you are advanced then you will have the opportunity to collaborate with others in developing trading strategies. I believe even advanced traders should work with others to keep heuristic thinking in check. Not only is collaboration very difficult to find, it is the ultimate goal of this group.
The overbearing ego resides in the know-it-all (KIA): a variant of trader I periodically encounter. The KIA claims to be advanced. He has an arrogance about him and speaks in certainties that imply some familiarity with the Holy Grail. He describes trades as “ATM machines” and occasionally brags about his profits. The KIA is often selling a trading system, a newsletter/advisory, or a premium website.
I need overbearing egos and KIAs to steer clear of this group. Collaboration requires us to leave egos at the door, maintain open minds, and attempt to look past biases and focus exclusively on the data. I reserve the right to ban any KIA who has leaked into the group.
The most important thing to me is that this group be actionable. Directly actionable may be a trading strategy that I can implement right now with reason why it is likely to profit. Indirectly actionable may involve pre-requisite concepts upon which an actionable idea is built. Topics that are not actionable include discussion about market or economic trends because the crystal ball for prognostication is broken. Also not actionable is discussion about corporate fundamentals and/or earnings in the absence of robust evidence to suggest significant correlation with predetermined market moves.
Finance is full of ideas that sound good on the surface and make great logical sense. Without supporting evidence, though, good ideas amount to little more than gambling.
Gambling, in my eyes, does not make good business sense.
Categories: Networking | Comments (0) | PermalinkMining for Trading Strategies (Part 6)
Posted by Mark on July 3, 2020 at 07:00 | Last modified: June 30, 2020 06:30Last time, I presented some study results with a caveat that the study was flawed. I proceeded to repeat the study.
I used the same methodology:
- Trained over 2011-2015 with random entry signals and simple exit criteria
- Tested OOS from 2007-2011
- Identified ~32 best performers over the whole 8-year period
- Collected performance data over incubation period from 2015-2019
- Re-randomized signals and ran simulation again for total sample size ~64
- Included slippage of $25/trade
- Included commission of $3.50/trade
Here are the results:

The five performance criteria shown are all better for 4-rule than 2-rule strategies. None of the differences are statistically significant (see final paragraph here), however. Perhaps they would become significant with a larger sample size.
The average trade is profitable regardless of group. This is encouraging! I couldn’t help but wonder, however, whether this was due to finding effective strategies or just plain luck. If I had collected data on average length of trade, then it would be interesting to compare this with average long trade of comparable length starting every trading day. The null hypothesis says there shouldn’t be any difference.
For my next study, I intended to reverse the IS and OOS periods to see if the positive performance was the result of aligning regimes for IS and incubation periods. Remember that I developed strategies (i.e. “trained”) over 2011-2015 and incubated over 2015-2019. Most of those eight years were bull market regardless of definition. Would I get similar results if I trained over 2007-2011, which includes a significant bear market cycle, and incubated over 2015-2019 (mostly bullish)?
Unfortunately, I was sloppy in doing this study and tested short positions rather than long. Here are the results:

Like the previous [long] study, all performance criteria favor 4-rule strategies. The Net PNL difference is statistically significant even after applying the Holm method for multiple comparisons. No other metric is significantly different (alpha = 0.05).
As expected, number of trades is significantly different because with more trade rules, the less likely all entry criteria are to be met on any given day.
Did you catch the big difference between this table and the table above?
Performance metrics for the short study are negative and significantly worse (by orders of p-magnitude) vs. the long study.
This is not encouraging and honestly makes me scratch my head a bit. I have this wonderful software that builds well-incubating long strategies but poor-incubating short strategies. Perhaps credit for the long study should not go to the software, but rather to some unknown, serendipitous similarity between the IS and incubation periods. Allowing up to four rules, wouldn’t inclusion of at least one be effective to keep the strategy out of markets during unfavorable environments?
I will continue next time.
Categories: System Development | Comments (0) | Permalink