Mining for Trading Strategies (Part 5)
Posted by Mark on June 30, 2020 at 07:57 | Last modified: June 25, 2020 11:29Today I want to present and discuss results from my initial testing of 2-rule versus 4-rule strategies.
The methodology is given in the third-to-last paragraph here.
I basically developed the strategies with random entry signals and simple exits from 2011-2015 and tested OOS from 2007-2011. I sorted by best performers over the entire 8-year period. I took the top (+/-) 60 (two simulations of ~30 each) and tested from 2015-2019. As the focus of my study, I then tested these strategies from 2015-2019 (incubation).
I applied $25 plus $3.50 / contract-trade to account for transaction fees.
The analysis consisted of T-tests assuming unequal variance in Microsoft Excel. I chose unequal because I had no reason to assume equal variance. I tested on five parameters: PNL, PNLDD, number of trades during incubation, average trade, and PF. Number of trades is not a performance metric and could probably have been left out.
Since I did five statistical comparisons, I adjusted the significance value from 0.05 per Holm Method. I think Holm is better than Bonferroni in this instance because the hypotheses are not independent: all measures of four rules versus two.
Here are the results:
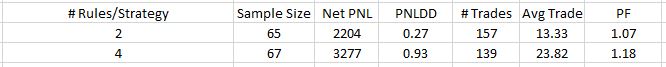
No differences were significant after application of the Holm method.
As I reviewed the study, I found that I made a few mistakes. First, the starting date was 2001 instead of 2007. Second, I had OOS set to 40% of the data instead of 50%. Third, I had cash set to be invested in the Biotech index instead of nothing. The latter probably affected strategies across the board and is nothing to be concerned about. It may have differentially affected the groups if one tended toward more/less time in the market during a period when Biotechs performed significantly better/worse than large-cap US equities.
I would rather do the study correctly before making too much of it. I will look to build on this with later studies.
Categories: System Development | Comments (0) | PermalinkMining for Trading Strategies (Part 4)
Posted by Mark on June 25, 2020 at 07:41 | Last modified: June 22, 2020 13:38Today I resume this blog mini-series with a slightly different approach.
I communicate with an algo trader who has recently gone live with his first strategy. If you have read about or watched algorithmic trading videos for any period of time, then you have seen pictures like his near-perfect equity curve. Also:
- Backtested over 19+ years
- PF > 9
- Total time in market < 30 months
- Maximum drawdown < 9% of initial capital
- Made money every calendar year
- Out of the market entirely for three consecutive years
- Passes Randomized OOS
- Beautiful Monte Carlo analysis
- Monte Carlo DD < backtested DD (see sixth paragraph here)
- Noise Test looks pretty good (which may not mean much)
I started discussing my attempt to validate Randomized OOS and he interrupted to say that I’m using lousy strategies. I was looking at simple, 2-rule strategies. He said I should be using at least four including signal exits. Even then, he said only 0.001% of strategies I find will actually “be good” (I assume by this he meant to be “viable” per this second paragraph).
Realizing his response was personal opinion not based on actual data, a couple things came to mind—the first one being whether I can ever validate a stress test if he is correct. I took one day to go through ~120 strategies; what would it take to show the stress test adds value if only one out of 100,000 strategies are good enough to be viable anyway?
A Chi Square calculator can answer this question. Even one in 2,000 is significantly better than one in 100,000, but that would take at least 17 days of backtesting.
I’m pretty sure 0.001% is way too low (see second paragraph here). I think one in 1,000 (0.1%), if not one in 200 – 500, is more like it. I don’t have actual data on this so I’m going to table it for now.
The second question that came to mind is whether 4-rule strategies are any better than 2-rule strategies?
I figured I could do this study by using the software to build random 2- and 4-rule strategies for long ES over 2007-2015. I ran the simulation for a couple minutes and then stopped. I took the best page of overall results (IS + OOS) and tested those on 2015-2019. I collected data on PNL, PNLDD, total number of trades, average trade, and PF.
I didn’t really have an opinion as to which group I thought would do better. The more rules, the greater the risk of overfitting would mean good performance from 2007-2015 and worse performance thereafter. However, 50% of the former period is OOS, which is not fit to anything. If the strategy is poor OOS then it’s probably not going to be one of the best. These are logical, contradictory ideas and as a result, I approached the results without bias and looked at two-tailed statistics.
I will continue next time.
Categories: System Development | Comments (0) | PermalinkRandom Simulation 1 (Part 2)
Posted by Mark on June 22, 2020 at 07:01 | Last modified: May 22, 2020 11:02Today I will conclude analysis of my first random simulation with the new software.
The more strategies I analyze, the more I hope to learn about what components are correlated with viability and profitability. I will also get a better feel for how representative particular results are relative to all strategies that I’ve studied.
Continuing on with the stress testing, the delay test doesn’t look so great:
I’m not sure how concerning this is. This delays entries and exits by x bars. When the strategy exits at the first profitable close or 15 days—whichever comes first—any delay in terms of 1+ bars could be an unrealistically large amount.
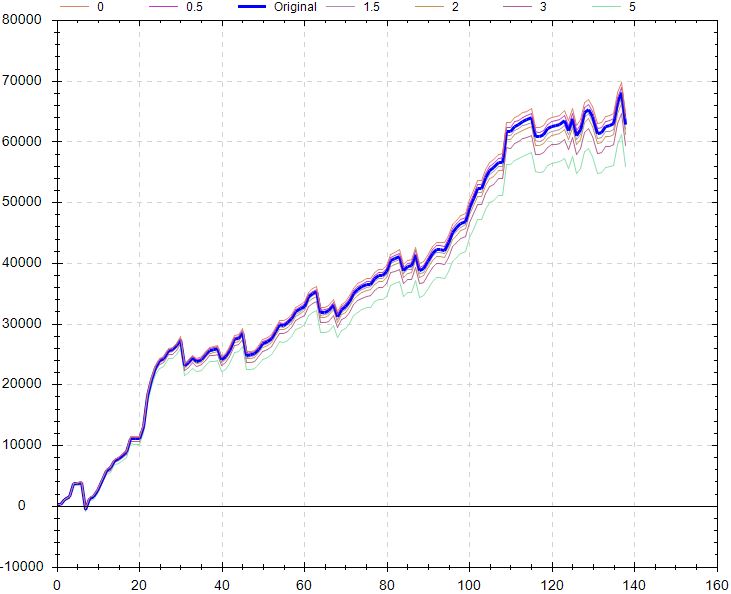
Factoring in worse execution might be more relevant and along these lines, the slippage test looks better:
Like the delay test, the liquidity test looks poor (my notes Screenshot 16), but I would pose the same questions. If profitable trades are being held for one day and entry is delayed by a large part of that period, then most of the profit potential evaporates immediately. Significantly poorer performance would be no surprise.
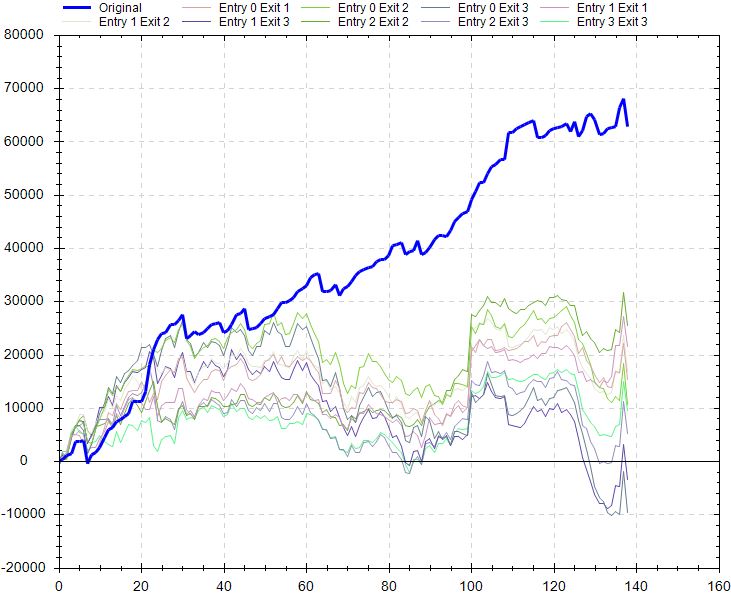
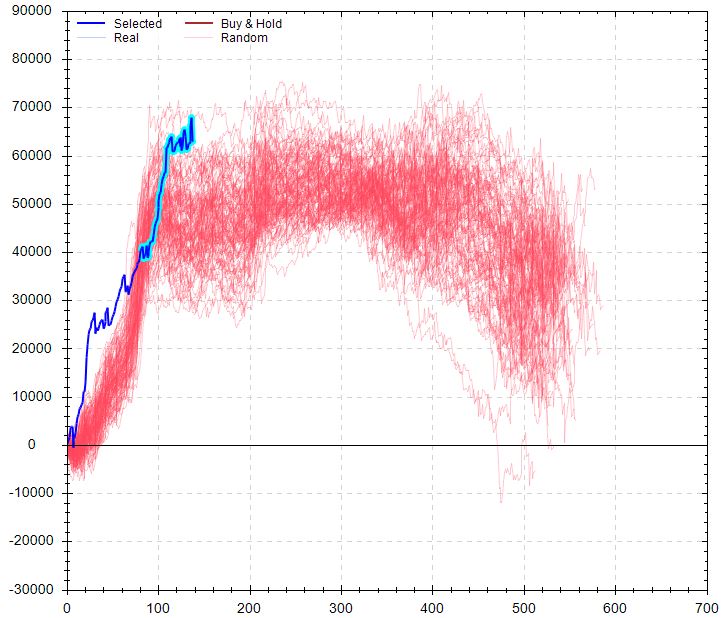
The noise test looks poor:
I included up to 25% noise here for OHLC. The actual backtest is pretty much the best equity curve on the graph. At least all the other simulations are profitable, but this suggests I shouldn’t necessarily expect such good performance if traded live.
For me, the second paragraph above especially resonates with something like the noise test. I would think altering the data series in this way would dramatically worsen any trading strategy that is better than random. I expect to better understand the importance and variety of noise test results as I get closer to studying a large sample size of strategies.
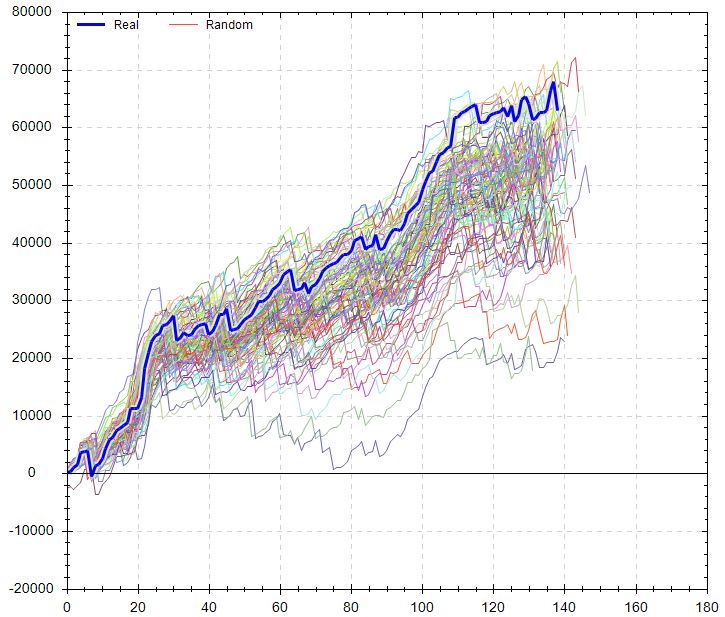
Randomized OS graph looks encouraging:
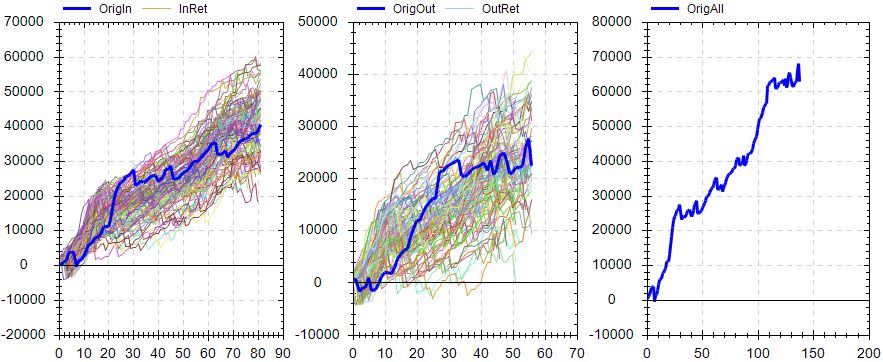
On the OS graph, the actual equity curve is right in the middle of the randomized simulations.
Overall, my initial impression is cautiously optimistic with this strategy. The OS curve looks solid. Performance versus random is solid. Monte Carlo is solid. MFE/MAE looks solid. Slippage test looks solid. The variance test seems pretty solid. Delay, liquidity, and noise tests don’t look so great. The randomized OS simulation looks ideal.
Further directions could include:
- Modifying the simulation dates
- Modifying [canned] exit criteria
- Toggling OS between beginning/end
- Changing fitness function
- Verifying the backtest in TS and studying performance report
- Checking on unseen data (i.e. incubation)
Another exploration would be to vary OS percentage with a caveat. While I think varying OS % may get me different strategies, with a minimum number of trades required, increasing OS % will exclude otherwise-qualifying strategies.
Random Simulation 1 (Part 1)
Posted by Mark on June 19, 2020 at 15:44 | Last modified: May 22, 2020 10:22As I enter the second stage of what I hope will be a long career in trading system development, this is my documentation of steps taken and my software learning process.
As a first attempt, I selected a desired market and direction along with random symbols (my notes Screenshot 1). I selected exit criteria as shown (Screenshot 2). I made sure to select at least 50 trades each and I selected 50% in-sample data. I entered max holding time (range with increment 5) and profitable closes (range with increment 2). I entered transaction fees (charge) and max number of two rules to minimize processing time.
Once the simulation had run, I was left with 500 strategies (Screenshot 3). The fitness results were eye-popping until I realized that I was looking at IS results.
I toggled to “both” (OS too) and turned on the equity curve thumbprint. I started scrolling down the list in search of good OS performance. This would be a curve that roughly matches IS performance, slopes flat/up, and does not have any large drawdowns. I was able to dismiss most strategies very quickly. When I later sorted OS results, I found only a few strategies that were even profitable (no wonder most curves looked poor!).
Then I got to #482:
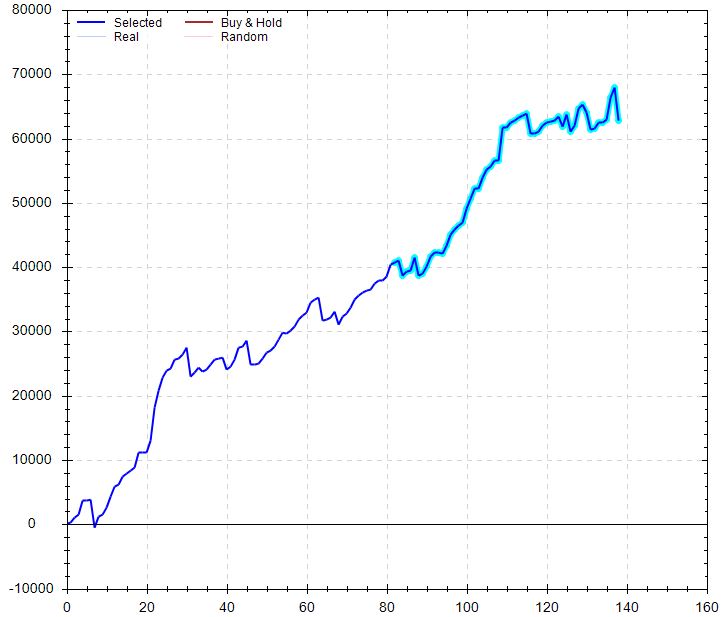
Performance was astounding versus B&H. Performance was pretty good versus random, too:
MFE/MAE looked really strong for days:
Lowering win rate by up to 10% and simulating 100 trades x1000:
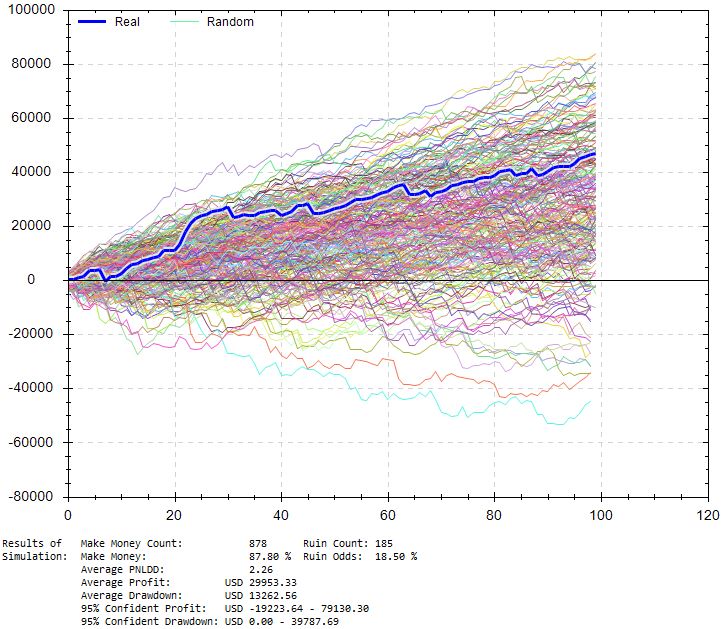
This shows an 18.5% chance of losing $10,000 with ~5% of drawdowns exceeding $40K. Average drawdown is just over $13K compared to $5,200 for the original backtest. PnL/DD remains over 2, which seems pretty solid. I could base position sizing off this, but being stressed conditions I don’t have context for reliability. In other words, I will run this test on all strategies but the amount of stress may differ depending on win rate, the impact of stressing may differ across strategies, etc.
I will continue next time.
Categories: System Development | Comments (0) | PermalinkWhat Percentage of New Traders Fail? (Part 4)
Posted by Mark on June 16, 2020 at 07:39 | Last modified: May 16, 2020 16:22Today I continue with excerpts from a Forex website forum discussion in 2013. The initial post, which tries to rebuke traditional wisdom, is Post #1 here. Forum content is unscientific and open to scrutiny. Do your own due diligence and buyer beware.
—————————
• Post #33, Nat:
> The brokerage data exaggerate the number of profitable traders.
>
> Say I start a new brokerage firm, and I sign up 100 new people
> every year and 95% fail and quit in the first year, the
> brokerage stats would be as follows:
>
> Year 1 – 100 new traders of which 5 are profitable (95% fail)
> = 5 profitable traders out of 100 or 5% profitable
>
> Year 2 – 100 new traders of which 5 are profitable (95% fail)
> plus 5 profitable traders from year 1 who are still on the
> firms books = 10 profitable out of 105 or 9.5% profitable
>
> Year 3 – 100 new traders of which 5 are profitable (95% fail)
> plus 5 profitable traders from year 1 and 5 from year 2
> = 15 profitable out of 110 or 13.6% profitable
>
> You also need to consider that profitable traders tend to have
> multiple accounts to offset the risk of losing all of their
> capital should their broker go bankrupt, or to take advantage
> of tighter spreads on different instruments. Losing traders
> tend to only have one account, therefore one profitable trader
> may be counted 3 or 4 times in these statistics depending on
> how many accounts they have.
• Post #39, King:
> I don’t believe the oft-quoted figure of 99%, 95% or 90% of
> new traders failing. You’re not designing a rocket that will
> travel to Mars.
This post makes me laugh now. First, as mentioned at the end of Part 3, I wonder if King has read the Brazilian day trading study? Second, as discussed in paragraphs 3 – 4 here, I think finding a viable trading system is extremely difficult. It may indeed be rocket science.
• Post #40, Nabi:
> The figures of profitable traders provided by the brokers do
> not account for the number of accounts being closed and opened.
>
> I read an article back in 2009 about IG index or IG markets…
> they had on average 50,000 accounts, year on year, which about
> 30% of them were profitable. The stand out figure I remember
> was that the number of new accounts opened per year 60,000.
> Whilst I cannot remember the exact figures I can clearly
> remember that the number of new accounts per year was
> greater than the average number of accounts held. If I recall
> correctly, the average account lifespan was about 3 months.
>
> …it still means the figures provided by brokers are worthless
> without the number of accounts open and closed within the year.
• Post #43, Trac:
> 51% profitable trades does not mean 51% traders are profitable.
>
> Also, check this DailyFX (FXCM) article… let’s use EUR/USD
> as an example. We know that EUR/USD trades were profitable 59%
> of the time, but trader losses on EUR/USD were an average of
> 127 pips while profits were only an average of 65 pips. While
> traders were correct more than half the time, they lost
> nearly twice as much on their losing trades as they won on
> winning trades losing money overall.
• Post #45, Kat:
> First of all, it says nothing about consistent profitability,
> because those 30% profitable in Q1 don’t have to be the same
> people in Q2, so 35% in Q2 can be made of different people
> than those 30% in Q1, etc.
>
> So you should accept that there is MAX 5% of consistently
> profitable traders making money every month (or quarter).
>
> And if you think that it is not true you probably still did
> not figure out how fking difficult this business is.
Here’s someone who clearly would believe the day trading study mentioned above.
To be continued…
Categories: Financial Literacy | Comments (0) | PermalinkDelving Further into TPAMs (Part 3)
Posted by Mark on June 11, 2020 at 11:28 | Last modified: May 11, 2020 13:41I’ve been going through my “drafts” folder this year trying to finish partially-written blog posts and get more organized.
TPAMs are Third Party Asset Managers. The August 2018 content below follows from Part 2.
—————————
In his article “The Coming Shakeout in Third-Party Asset Managers,” Greg Luken argues that TPAMs will face a leaner environment going forward. In order to survive, they will need to provide:
> A truly differentiated investment approach. In one of the most
> well-known studies of consumer behavior in America—the so-called
> “Jam Study”—two psychologists found that shoppers at a Bay-area
> grocery store were 10 times more likely to purchase one of the
> jams on display when the varieties of jam available were reduced
> from 24 to six.
>
> This pattern should be familiar to any advisor who has tried to
> parse through the vast number of available TPAM offerings on their
> broker/dealer’s platform lately. Past a certain point, adding more
> options to the menu does not benefit the advisor; it simply places
> another burden on their time in order to figure out the
> differences in the various choices.
>
> Going forward, TPAMs that are successful in defending their
> position on broker/dealer product platforms will be those that
> offer clearly differentiated investing approaches and results,
> not those whose portfolios boil down to minor variations on
> readily-available index funds, or a slightly different take on
> large cap growth.
This largely echoes my sentiment.
In addition to being truly differentiated, I believe TPAMs should be better. Perhaps Luken doesn’t address performance because it tends to be highly variable and never guaranteed (“past performance is no guarantee of future results”). Regardless, if the average bank product return is 2% and stocks on average have returned 8% per year then a professional delivering 6-7% per year is far better than the 2% people can achieve on their own. I believe, though, that being “professional” means they should do better than 8% per year.
My expectation for professionals to beat the market may be holding the bar too high. An internet search of “do professional traders beat the market” will turn up many articles arguing to the contrary. Over long periods of time, hedge funds certainly haven’t been able to do this. If beating the market is unlikely then perhaps “plain vanilla” will suffice especially if it consistently comes close to matching the market like passive index fund investing. Even this passive approach, which is exhaustively detailed in any Dummies Guide may be well worth the management fees.
It’s still hard for me not to expect something more. My last paragraph simply suggests realizing more is worth paying up for and if more isn’t delivered I probably won’t have to pay much (see fourth paragraph here).
Categories: Uncategorized | Comments (0) | PermalinkThe Mixed-Up Files of SEMI Collective (Part 1)
Posted by Mark on June 8, 2020 at 06:34 | Last modified: May 7, 2020 14:33I’ve been going through my “drafts” folder this year trying to finish partially-written blog posts and get more organized. This is another series of unfinished posts.
From October 2016, I have a post about the SEMI group concept. I also have four other unfinished drafts. I have cursorily looked at these drafts along with the actual post. The content is different.
This particular draft is from October 11, 2016, and has 21 revisions. I therefore worked quite a bit without ever getting it done! In the longshot case that someone out there could possibly benefit from any of this, here is (I think) Part 1.
———————————-
Welcome to the SEMI Trading Collective. The ultimate goal for this group is to establish a critical mass of focused minds working together to develop effective trading strategies.
My name is Mark and I left Corporate America over eight years ago to start trading for a living. Since that time I have been able to cover the annual living expenses with trading profits alone. While a substantial amount of hard work does underlie this accomplishment, I am very grateful for the results to date.
Aside from my trading experience, I also am prepared to do some teaching to get beginners up to speed. Developing trading strategies will require a high level of sophistication. I am willing to teach passionate students. If a slew of advanced traders joins this group then my teaching may not be necessary.
As a means to establish accountability, participation in this group will require a monetary contribution. I believe most groups fail because people come and go with varying levels of commitment and no consistent work flow subsequently achieved. Nothing I can do can force you to attend, to study, or to learn. I can only charge a fee in an attempt to filter out people who are not serious. This may keep group membership down but we only need a few engaged individuals to form a productive and [hopefully] profitable group.
The costs for this group include $10/year membership and $10 per Meetup. This is a pittance compared to fees charged throughout the industry for “educational programs”—many of which simply aim to upsell more expensive seminars—or “investment services” that often fail to deliver on rosy promises. I believe anyone who finds this fee structure too steep is either not in an acceptable financial position to trade or not adequately committed to developing the craft.
Categories: Networking | Comments (0) | Permalink2018 Incident Report (Part 6)
Posted by Mark on June 5, 2020 at 07:51 | Last modified: May 13, 2020 13:17I’ve been getting more organized this year by converting incomplete drafts into finished blog posts. Today I conclude a July 2019 draft reviewing my 2018 trading performance.
—————————
When I’m not making money it feels terrible: no doubt about that. I feel like a failure, like I should go back to work pharmacy, etc. I want a better way although I should not look to throw the baby out with the bathwater. If the worst I ever do in a year is lose 5 – 10% then on the whole I’m going to be a star and I have to remember that.
Perhaps never do I feel more on-edge than when I am out of the market with uncertainty over when to get back in. The volatility train does not arrive often and when it does it usually makes for a short stay. I hate to be on the sidelines when the train leaves the station, which is why I am so quick to jump back in after making a large exit.
I need a better way. I need to backtest something with a sufficiently large sample size in which I can believe. Otherwise, I will feel like this is mere gambling.
A couple other thoughts for exit strategy include:
- Close partial positions when I am down one month’s usual income
- Start selling the call side when down one month’s usual income to better hedge against downturns (but how will that fare in rising markets?).
- Switch to a symmetric, BWB, or verticals instead of NPs. On this point, I could go back to the idea of selling $0.30 on a $5 spread to make 6% per month or 72% per year. If I allocate only 20% of the portfolio then that is 14.4% per year with no possibility of losing more than 20% in a month. That’s still not a great deal risk/reward ratio, though.
Here’s one more batch of random thoughts:
> Part of my problem this year had to do with anchoring and greed.
> I started the year making good money in Jan. I then lost much
> more (quickly) in Feb. From the time that I got back in
> (slowly), I worked several months to catch up through Oct when
> I was up ~10%. I knew it wouldn’t be my usual good year (or
> maybe I was just comparing to +36% last year) so I was
> patient… and then probably dead-set on holding longer and
> hoping the market would stay up—until it didn’t. I had a
> decent idea to get out if my YTD gains evaporated (first chance
> to get out when market went into backwardation was Oct
> when I was still up 4 – 5%). I was then too eager to start
> getting back in at first glance of normalcy. After a couple
> days of contango, I re-entered and then lost more. Sporadic
> trades thereafter lost as well. By the time I truly called
> it a year on Dec 20, I was down close to 10% (of my initial
> 2018 equity value; this would be more than 10% of my initial
> 2017 equity value on which the +36% is calculated).
>
> Going forward, I must work on developing rules and sticking
> with them no matter what. Sticking to the plan must be
> everything. One way or another, I’m going to be
> frustrated when the market goes against me. I might as well
> be frustrated knowing that I at least followed my rules
> because the alternative to following rules is to hope.
> If all I have is hope and I lose more because of it—which
> has happened with every major loss I have suffered to
> date—then I’m going to feel even worse and kicking myself
> back to the drawing board like I am right now.
2018 Incident Report (Part 5)
Posted by Mark on June 2, 2020 at 07:58 | Last modified: May 13, 2020 11:19Once again, today I continue with an unfinished July 2019 draft evaluating my 2018 trading performance.
—————————
With regard to getting out, I wrote to colleague FM:
> As I said, I want to be out when the market gets volatile because
> all of the largest market crashes have been preceded by some sort
> of craziness. The trick is getting out too soon or too late and
> there is no magic bullet that will work for all occurrences. In
> general, though, “craziness” involves wide market swings, regular
> 1+ SD moves, longer-term moving averages being pierced to the
> downside, VIX levels breaking through resistance, etc.
>
> I had a mental stop at YTD profits for my account. Once those
> evaporated I got out—and in retrospect, I’m glad I did because had
> I not then I certainly would have the very next day with much
> bigger losses.
>
> …I know you got frustrated previously seeing $307K go down to
> $251K so I closed [those] positions… to preserve some gains.
>
> With a sliver of [the] portfolio invested in NPs, one could make the
> case for me to keep trading [the] account per usual. The benefit of
> getting out would be to prevent even [that] sliver from incurring the
> biggest losses because at some point, there will probably be a major
> market crash on the order of 20%, 30%, or more. Trading this way,
> I can probably avoid those excess losses. The right answer is
> only knowable in retrospect.
Colleague FM responded:
> Your response is consistent with prior concerns about managing
> volatility. The backtest through 2008 seemed to produce very good
> results and I am not sure why volatility this year would be especially
> concerning.
>
> Regardless, much of your trading is based on how you feel about the
> market; which is not atypical of traders. However, if you are trying
> to sell a methodical, long term process, you will have a hard time
> as there is not a definable structure.
I’m actually trading larger and with more variable capital than done in the backtest. This may be part of the problem.
If I were just trading OPM then I would commit to trading consistently and regularly. I might have to stop trading my own money, though. I might also have to somehow separate myself from the client. Talking about this in times of market turmoil puts me even more on-edge since I always want to be cautious, qualify what I say, and not be too arrogant so as to be subsequently bitten in the behind due to excessive hubris.
I will conclude with my next post.
Categories: Accountability | Comments (0) | Permalink