Backtester Development (Part 9)
Posted by Mark on December 19, 2022 at 06:29 | Last modified: June 22, 2022 08:37Today I want to finish updating what I have for backtester logic beginning with other considerations regarding maximum excursion (ME; see end of Part 8).
I’m not convinced that I need to report ME in btstats. As the statistic itself refers to an intratrade value, I can only think of two reasons to include it in the intraday report: to see how it changes over the course of the trade, which doesn’t matter to me, or to see exactly when it occurs, which I know anyway because I store that number separately ( _dte). All the context I probably need is in summary_results where I will also see initial DTE and DIT.
Besides, comparing ME across trades is easy in summary_results but much more difficult in btstats. In the former, each row corresponds to one trade and looking at ME across trades is as simple as scanning from row to row. In the latter, multiple rows correspond to each trade and I would need to do a lot of scrolling and looking up ‘WINNER’ or ‘LOSER’ in trade_status.
Removing ME from btstats will simplify an if-elif-else to if-else since ‘WINNER’ and ‘LOSER’ are otherwise handled the same.
And if trade_status is ‘WINNER’ or ‘LOSER,’ then before continuing data file iteration the program proceeds to:
- Assign ‘INCEPTION’ to trade_status
- Assign ‘find_spread’ to control_flag
- Reset all variables (fifth-to-last paragraph of Part 7 aside)
- Assign True to wait_until_next_day
I added a profit factor calculation to summary_results by:
- Appending two more rows (dictionaries) for mean and count of wins and losses by doing
summary_results = summary_results.append ( { } ) [not just summary_results.append()] - Calculating PF_calc by using .iloc[ ] to look up particular values
- Appending a row at the bottom to display PF_calc
Finally, I once again had to debug the graphing portion having to do with the x-axis tick labels that I discussed here, here, here, and here. I end up resolving this with three lines:
L1: xtick_labels = pd.date_range (btstats [‘Date’] . iloc[0], btstats [‘Date’] . iloc[-1] , 20 )
This creates a list of 20 evenly-spaced trading dates including the first and last.
L2: xtick_labels_converted = xtick_labels . strftime ( ‘%Y-%m-%d’ )
This is needed to avoid ConversionError [“Failed to convert value(s) to axis units”] from L3.
L3: axs[0] . set_xticks (list (np . linspace (1, len (btstats . index), num = \
len (xtick_labels_converted) ) ), xtick_labels_converted, rotation = 45)
This plots the evenly-spaced date labels at evenly spaced locations on the x-axis.
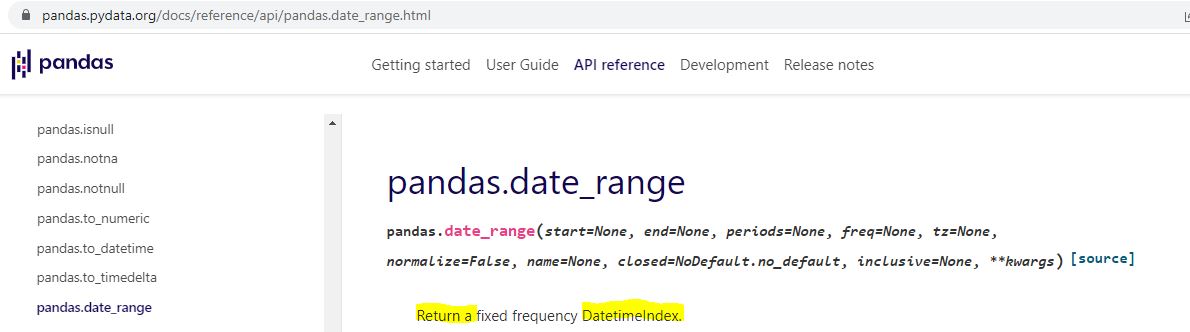
Technically speaking—and these are the details on which I get hung up and confused as a beginner—pd.date_range() in L1 returns a Datetimeindex. How do we know that and what does it mean?
I can do an internet search for pd.date_range:
I can do an internet search for datetime index:
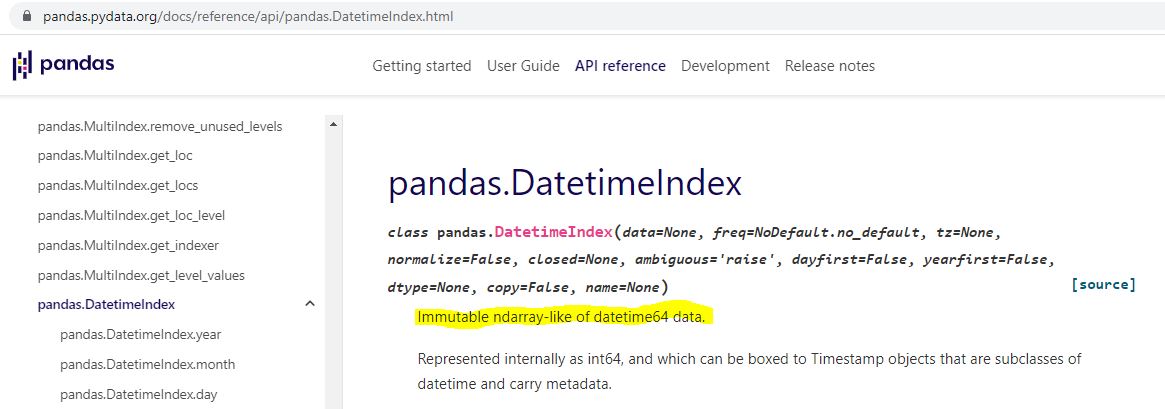
Is “ndarray-like” bad English? An internet search turns up a page that explains this, too.
Ndarray can also be better understood by an internet search:
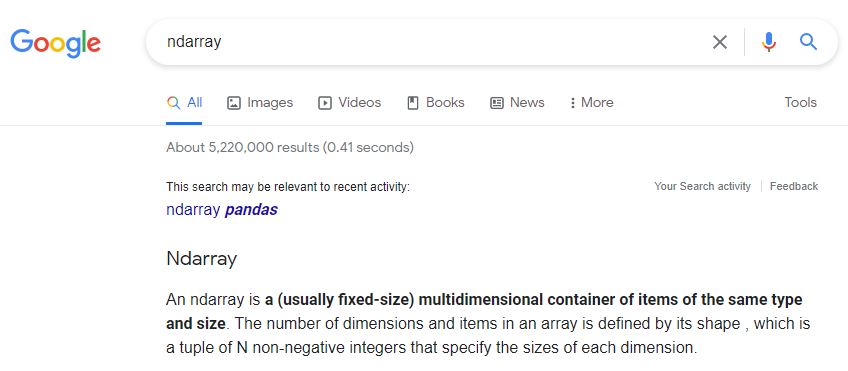
I don’t know much about arrays yet, but I do know they are a different data type from what [an internet search has informed me that] ax.set_xticks() is expecting:
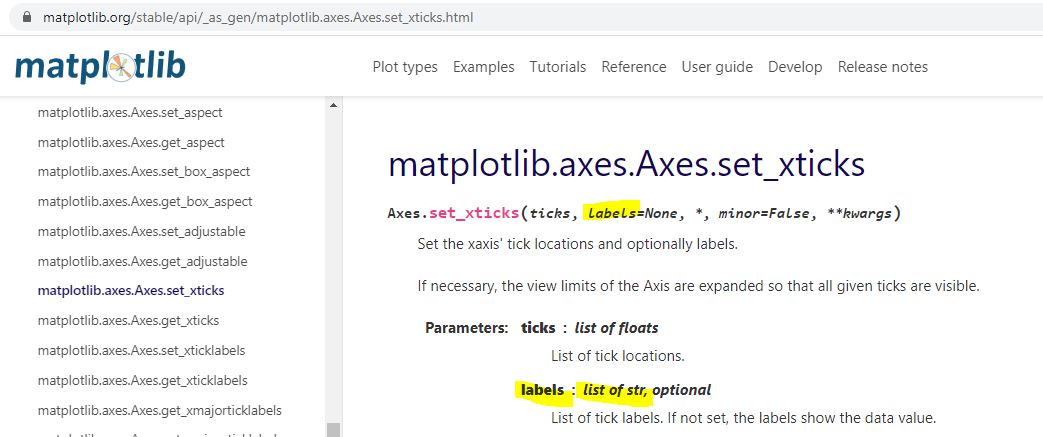
Type str[ing] rather than [type] array or Index is expected. The Datetimeindex has large integers that nobody would want to see as tick labels anyway. L2 converts those to strings with a familiar character format (YYYY-MM-DD).
That pretty much covers the updated logic for this version of the backtester.