Resolving Dates on the X-Axis (Part 2)
Posted by Mark on June 17, 2022 at 06:45 | Last modified: April 4, 2022 14:47Today I conclude with my solution for resolving dates as x-axis tick labels.
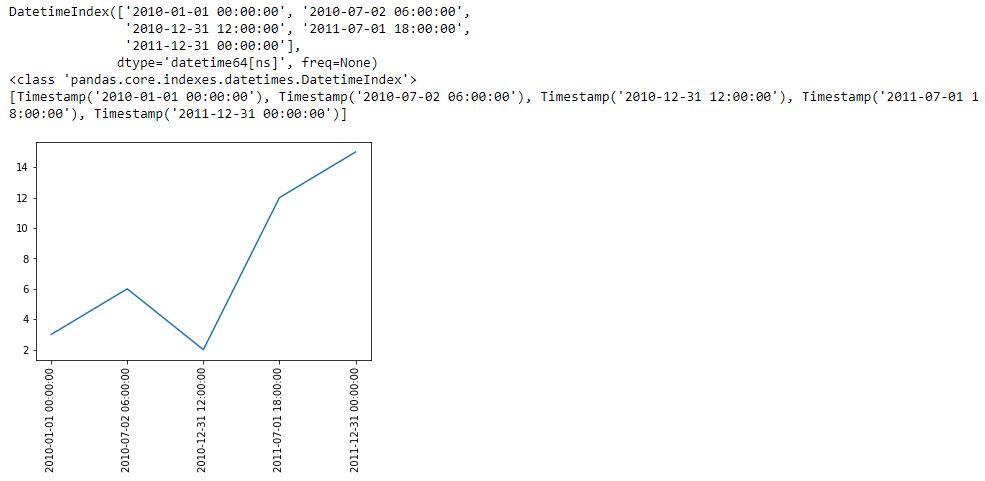
I think part of the confusion is that to this point, the x-coordinates of the points being plotted are equal to the x-axis tick labels. This need not be the case, though, and is really not even desired. I want to leave the tick labels as datetime so matplotlib can automatically scale it. This should also allow matplotlib to plot the x-values in the proper place.
Documentation on plt.xticks() reads:
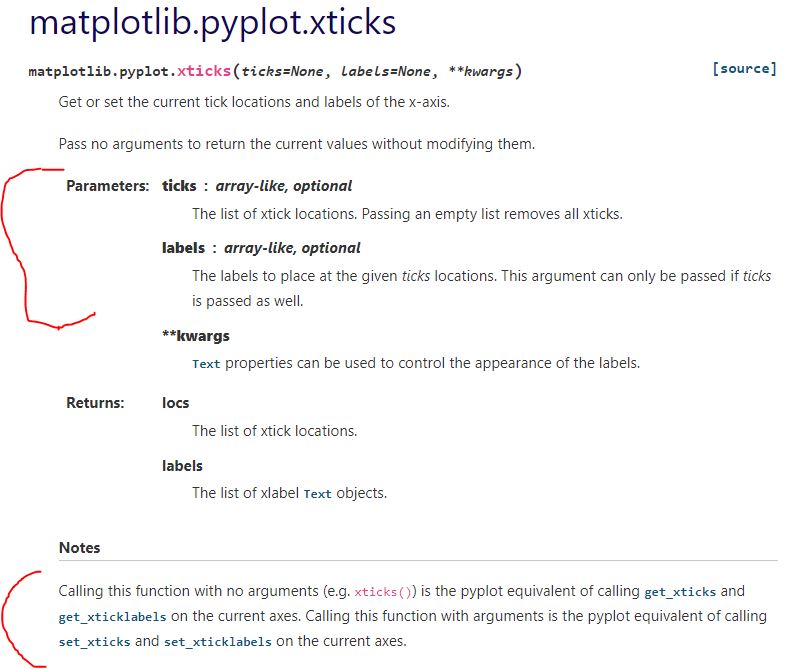
The first segment suggests I can define the tick locations and tick labels with the first two arguments. For now, those are identical. Adding c as the first two arguments in L11 (see Part 1) gives this:
Ah ha! Can I now insert a subset as a different time range for the x-coordinates?
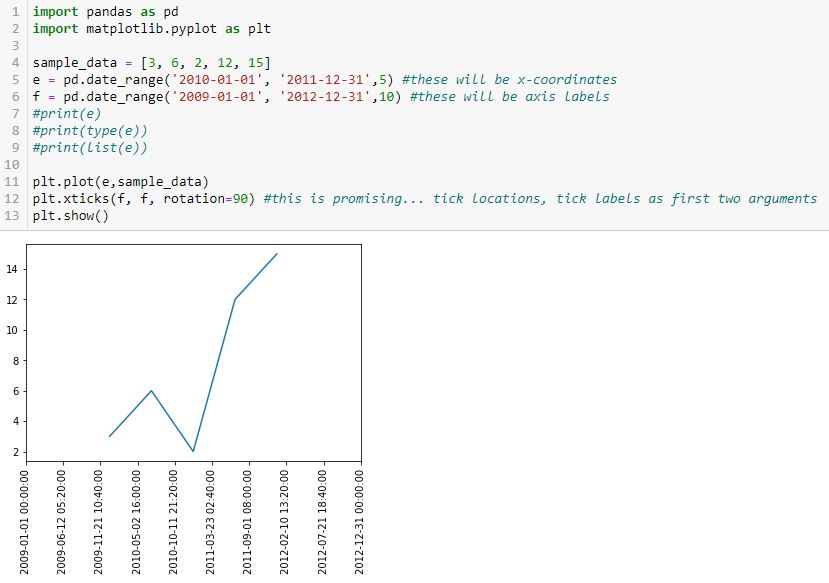
I think we’re onto something! I commented out the print lines in the interest of space.
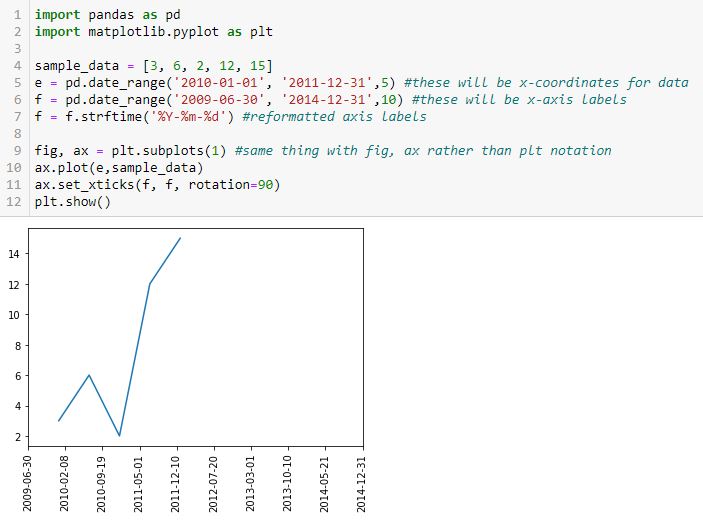
Finally, let’s reformat the x-axis labels to something more readable and verify datatype:
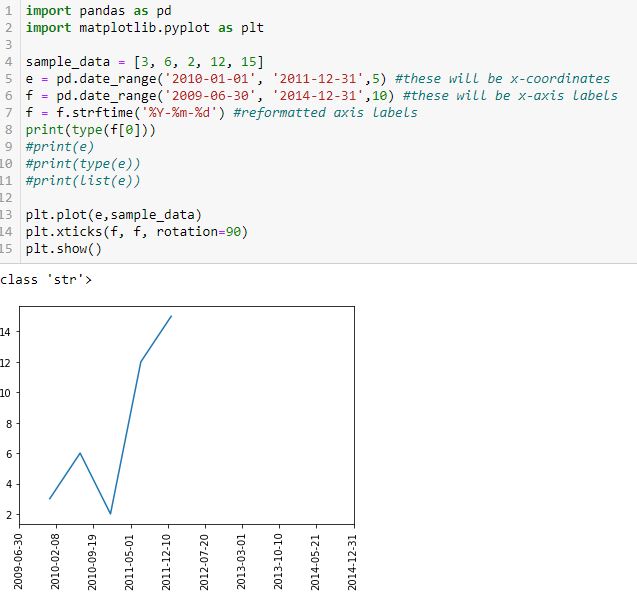
Success! I am able to eliminate hours, minutes, and seconds. Interestingly, the axis labels now show up as string but matplotlib is still able to understand their values and plot the points correctly (I suspect the latter takes place before the former). Changing the date range on the axis helps because this graph should look different from the previous one.
To put in more object-oriented language:
I suspect the confusion between the plt and fig, ax approaches is widespread. For a better explanation, see here or here.