Resolving the X-Axis (Part 1)
Posted by Mark on June 6, 2022 at 07:30 | Last modified: March 31, 2022 11:52As it turns out (see here and here), some of the matplotlib debugging came down to better understanding the zip() method. I still have some further considerations to resolve.
I would like to enlarge the graph so the axis isn’t so crowded when every label is included.
First though, I want the x-axis tick labels and locations to be handled automatically. I want z labels spaced evenly throughout the time interval from first Friday to last Friday. Alternatively, I may want to try plotting labels only where new trades begin.
When left to plot the x-axis tick labels automatically, others were seeing consistent tick labels on the 1st and 15th of each month as discussed in the third paragraph of Part 7. That would be acceptable, but for some unknown reason, I got asymmetric labels on the 1st and 22nd of each month as shown near the bottom here.
I stumbled upon the Matplotlib.ticker.FixedLocator Class, which is seen in L10 below:
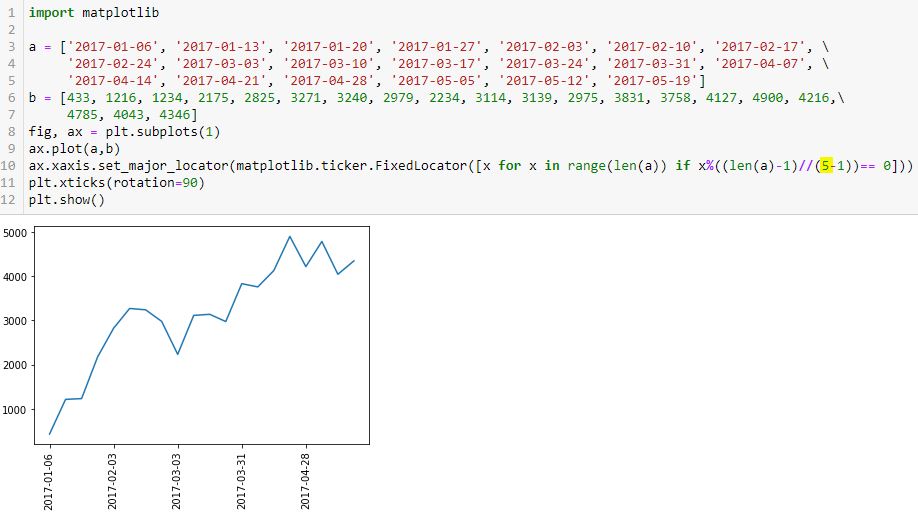
The highlighted number is the number of tick labels that I expect to see. I determined this by trial and error (it requires the minus one). I want constant spacing across these labels and eventually, I’d like the program to calculate the optimal number.
Let’s break this down to see how it works (or not):
> [x for x in range(len(a)) if x%((len(a)-1)//(5-1))== 0]
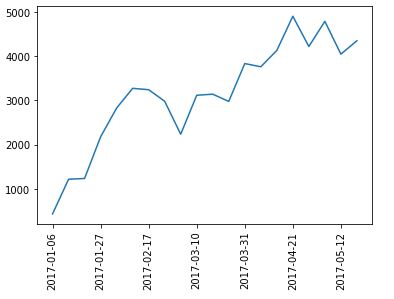
This is a pretty complicated piece of code for a beginner (me). First, we have to recognize it as a list comprehension: it will generate a list. A list will direct the program to place tick labels at specified locations as shown just above the first graph here.
The list will be generated as follows:
- len(a) is 20 (items in list a).
- range(20) creates a range object starting from 0 and going to 19.
- x for x in range(len(a)) will iterate over the range object and place each entry in the list…
- …if the subsequent condition is met.
- Subsequent condition involves the modulo operator (%), which calls for division remainder.
- Numerator is x.
- Denominator is (len(a)-1) // (5-1)
- // is floor division, which truncates any remainder.
- len(a)-1 // (5 – 1) = (20 – 1) // 4 = 19 / 4 = 4.75, which gets truncated to 4.
- Subsequent condition therefore calls for multiples of 4 (x / 4 will have remainder == 0).
- From 0 to 19, multiples of 4 are: 0, 4, 8, 12, and 16.
- These are exactly the dates shown as x-axis labels (count L3 – L5 dates with first being #0).
If I populate the highlighted number as 1, then I’ll get division by zero (not good). I’d never want just one tick label anyway. Two works along with 3, 4, and 5.
What about 6?
I count seven tick labels.
Houston, we have a problem.