Resolving the X-Axis (Part 2)
Posted by Mark on June 9, 2022 at 07:22 | Last modified: March 31, 2022 17:30I left off last time with a promising solution for setting x-axis labels using the Matplotlib.Ticker.FixedLocator Class. Unfortunately, the example at the bottom shows this doesn’t work for all values, which calls the solution into question.
What’s going on? Take a look at the following code snippet:
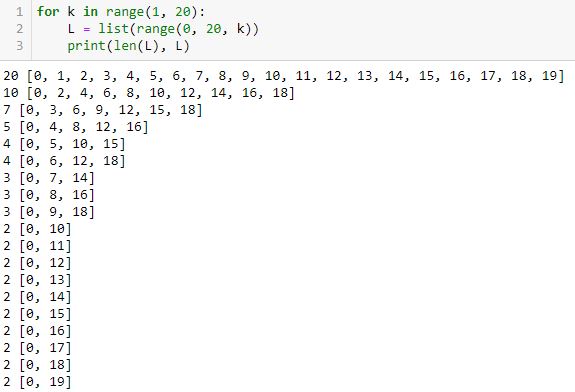
This shows for equally-spaced tick labels having integer coordinates, only certain numbers of labels are possible: 2, 3, 4, 5, 7, 10, and 20. I did not get six because it’s not mathematically possible. The same holds true for 8-9 and 11-19. When multiple equally-spaced lists are possible, I was really aiming for the one with the last element closest to the final date in the list.
In order to code this stuff accurately, I need to articulate exactly what I’m trying to achieve. I failed to do that.
Aside from the FixedLocator Class, another way to approach this is with np.linspace(a, b, c). This automatically creates a linear space of c-point subdivisions between a and b inclusive (i.e. a and b always included as the first and last values):
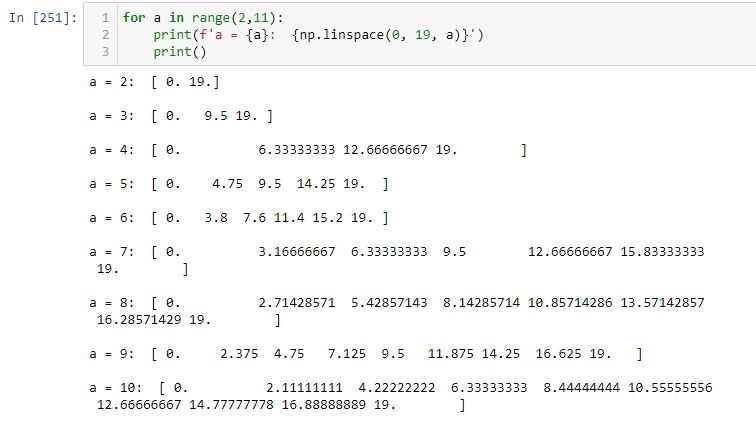
Note how each list begins and ends with 0 (a) and 19 (b), respectively.
How do the plots look with different numbers of x-axis labels?
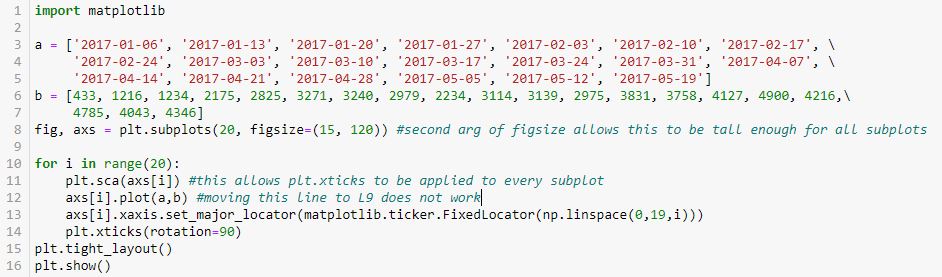
In the interest of space, I will describe rather than show the output. We get 20 subplots where the number of tick labels increases from zero to 19 by an increment of one for each subplot. The graphs are identical—the only thing that changes is the number of equally-spaced tick labels. Outstanding!
Some highlights of this code are as follows:
- The figure and axes are drawn in L8.
- L8 also includes the figsize argument to make the graphs larger (see second paragraph of Part 1).
- plt.sca(), as originally shown in L35 of this second code snippet, rotates x-axis labels for each subplot (a simple thing that took major work to figure out).
- L10 and L13 are basically applying the np.linspace() exercise shown above to the x-axis labels on the subplots.
I’m quite happy with the progress made here!