Debugging Matplotlib (Part 6)
Posted by Mark on May 19, 2022 at 06:28 | Last modified: March 23, 2022 11:06I left off with a seemingly counterintuitive situation where plt.xticks() either effects something yet to be generated or gets undone by something later in the program. After completing that last post, though, I had a shocking realization: I THINK I KNOW THE ANSWER AS A RESULT OF MATPLOTLIB EXCEPTIONS HAVING BEEN RAISED IN MY PAST WORK!
Exceptions are usually frustrating because they force me to problem solve something I inadvertently did wrong. Now, that past frustration proves quite beneficial in leaving the indelible image in my mind of a completely blank graph.
Let me simply the code to include only the imported modules and the first graphing line:
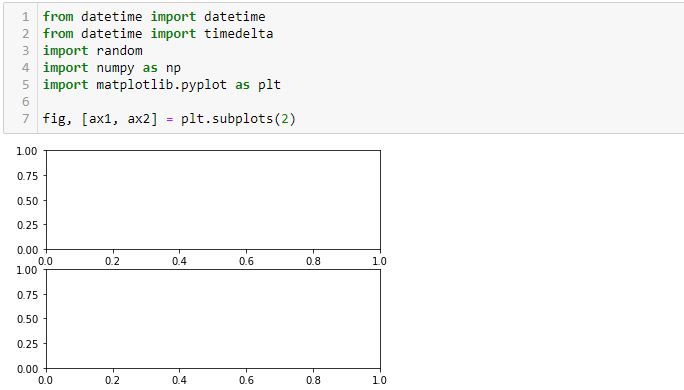
I completely erred in my reasoning throughout the last four paragraphs of Part 5. Neither L3 nor L6 draws any axes. All axes are generated in L1 and this includes the “last [second set of] axes.” L4 and L7 both operate on the second set of axes defined in L1, which is why only the x-axis labels of the lower graph were rotated.
This makes more sense. There is no retroactive operation and no need to hold a command in memory for something not yet generated—both of which seem very “unpythonic.”
Having said all that, experiencing a natural high, and catching my breath, this snippet produces the desired outcome:
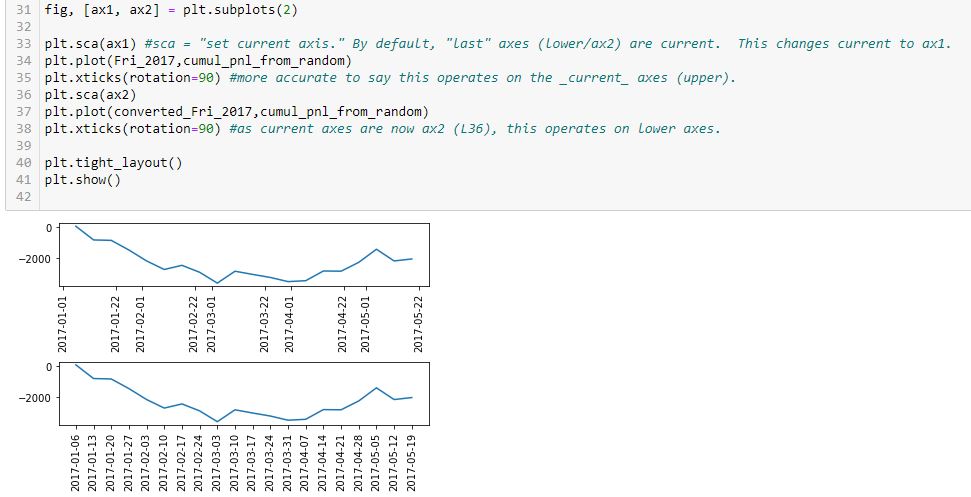
Technically correct is to say current axes are those drawn last by default. Current axes may be explicitly set as shown here. This is how to vary the target of plt.xticks() to get x-axis labels rotated on both graphs.
Now…
Why is the spacing of x-axis labels different on these two graphs?
I will address that next time.