Debugging Matplotlib (Part 5)
Posted by Mark on May 16, 2022 at 07:27 | Last modified: March 22, 2022 16:42Last time, I laid out some objectives to more simply re-create the first graph shown here. I will continue that today.
Objectives #2-3 are pretty straightforward:
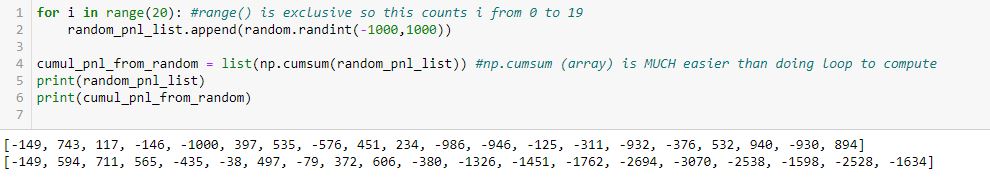
In L2, the arguments for random.randint() are inclusive. You can see a -1000 as part of the first list at the bottom.
Also, note the second line of output is also a list. np.cumsum() generates an array, but the list constructor (in L4) converts this accordingly. Using np.cumsum() does this in one line as opposed to a multi-line loop, which could be used to iterate over each element of the first list subsequently adding to the last item of an incrementally-growing cumulative sum list.
Not seen are a couple additional modules I need in order to use these two methods:
> import random
> import numpy as np
I am going to skip ahead to objective #5 for the time being: the graph. Here is my first [flawed] attempt:
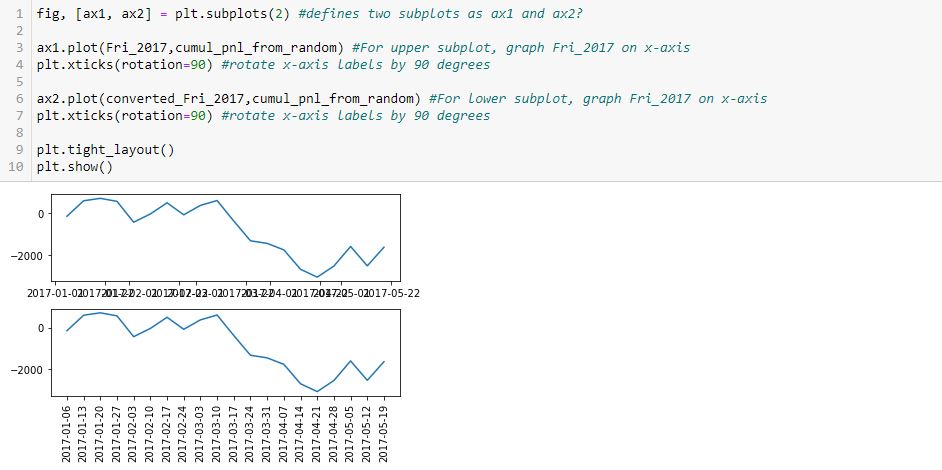
As you can see, the x-axis labels are rotated in the lower subplot but not rotated [and thereby rendered illegible] in the upper. Why do L4 and L7 not accomplish this for both subplots, respectively?
After googling this question a few different ways and looking through at least 20 different posts, the best response I found is this one from Stack Overflow: [no matter where the line appears in the code] “plt manipulates the last axis used.” Here, the last subplot is rotated but the first is not. What confuses me here is where plt.xticks() appears. In order to get the output seen, does the first subplot get rotated by L4 only to be unrotated with generation of the subsequent [last] axis at L6? Does L7 then rotate the x-axis labels on the subsequent [last, or lower] subplot?
I find it extremely counterintuitive for a later line in the program to undo an earlier one because the earlier graph has already been drawn. I can test whether L7 actually rotates the x-axis labels in the lower subplot by commenting it out:
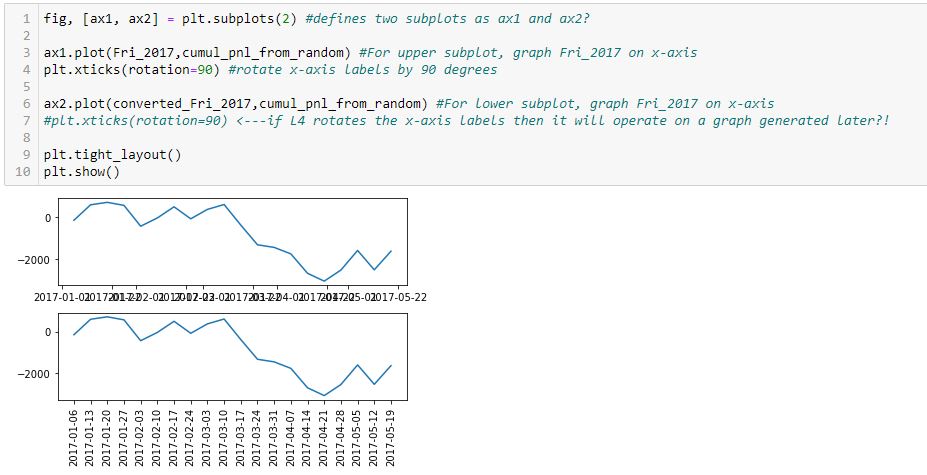
Indeed, this output is the same as the previous, which suggests a later line does not undo an earlier one. Rather, the earlier line effects a graph drawn later.
How does that work, exactly?
Categories: Python | Comments (0) | Permalink