Debugging Matplotlib (Part 8)
Posted by Mark on May 26, 2022 at 06:44 | Last modified: March 26, 2022 11:24Getting back to the objectives laid out here, I completed #1 in Part 4, #2-3 in Part 5, and #5 in Part 6. I will resume with objective #4: randomly select five Fridays as trade entries.
This line is pretty straightforward:

Finally, this snippet allows me to conquer objective #6:
This is actually somewhat complex code for a beginner like me. I will go over a few points.
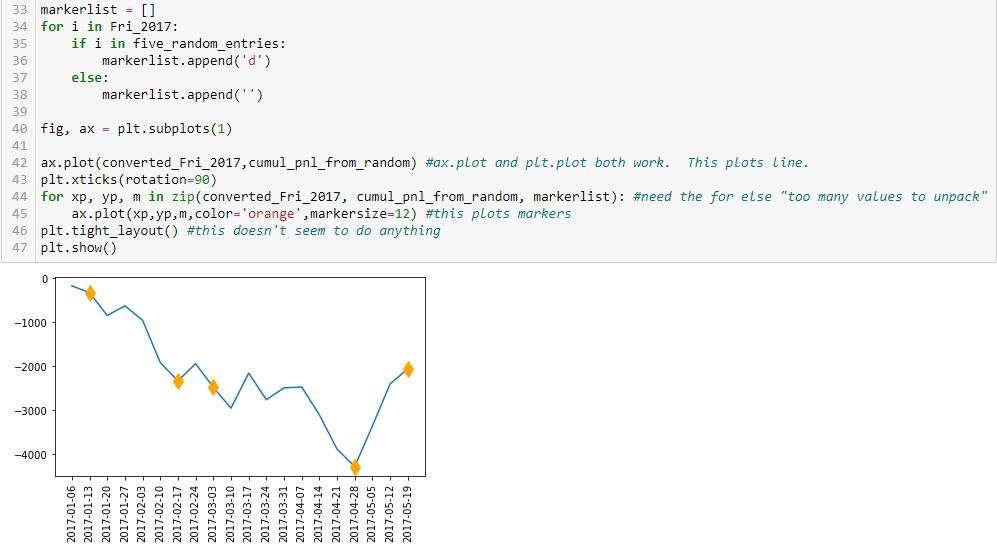
First, note that I have simplified the graph from two subplots to just one. The reason for including two subplots earlier was only to compare tick labels on the x-axis.
Second, look at the syntax of L45. The arguments are x-values, y-values, marker code, color, and markersize. L42 is an abbreviated version with just the first two arguments. L45 plots the markers while L42 plots the line. How does this work?
In L42, the arguments are datatype list.
In L45, the datatype is more complicated. The first three arguments of L45 are generated in L44 from a zip function. From W3Schools.com:
> The zip() function returns a zip object, which is an iterator of tuples where
> the first item in each passed iterator is paired together, and then the second
> item in each passed iterator are paired together etc.
The zip function itself produces a zip object. Trying to directly unpack the object into variables does not work:
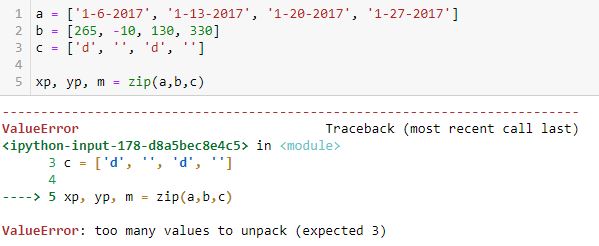
I’m still trying to understand what the “too many values” are. I would expect to get a list of (xp, yp, m) tuples from this.
As it turns out, I can get such a list with the list constructor:
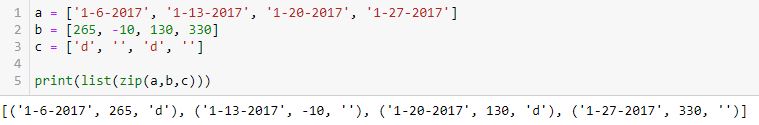
Like the list constructor, the for loop is an iterator that goes over the iterable until nothing is left. Each time, it unpacks three values from the zip object: one from each list. These then get presented to L45 as the x-value, y-value, and marker code. This plots a set of points showing up as diamond markers or blank instead of a continuous line because each time three separate values are presented rather than two lists being presented at once? It’s hard for me to articulate this, which suggests that I don’t fully understand it yet.
Next time, I will do a bit more digging in order to explain this better.
In the meantime, mission accomplished for all six objectives!
Categories: Python | Comments (0) | Permalink