HEI Stock Study (1-18-23)
Posted by Mark on January 31, 2023 at 07:11 | Last modified: February 11, 2023 16:55I recently did a stock study on HEICO Corp. (HEI) with a closing price of $165.46.
This medium-sized company has grown sales and EPS at annualized rates of 8.8% and 15%, respectively, since 2013. Visual inspection shows lines mostly up, straight, and parallel with a slight pullback in ’20 [and ’21 for EPS]. PTPM has increased from 17.9% to 22.2% over this time while mostly trending higher. The 5-year average is 20.9%, which far outpaces peer (stated by M* as AJRD, HWM, and DRS) and industry averages.
ROE has been flat to slightly lower over the last decade going from 17.6% (2013) to 14.2% (2022). At 16.6%, the 5-year average slightly outpaces the peer average. Debt-to-capital has fallen from 38.4% (2013) to 10.5% (2022) with a 5-year average of 20.2%. This is significantly less than peer and industry averages. Interest Coverage is an impressive 77.
Value Line writes:
> HEICO Corp. engages in the design, manufacture, and sale of aerospace,
> defense, and electronics-related products and services. It operates in
> two segments: The Flight Support Group (50% of 2021 sales) designs and
> manufactures jet engine and aircraft component replacement parts. The
> Electronic Technologies Group (50%) manufactures various electronic,
> microwave, and electro-optical products.
I assume long-term annualized sales growth of 10% based on the following:
- CNN Business projects 18.2% YOY and 12.8% per year for ’22 and ’21-’23, respectively (based on 13 analysts).
- YF projects YOY 17.9% and 7.6% for ’23 and ’24, respectively (13 analysts).
- Zacks projects YOY 15.3% and 8.4% for ’23 and ’24, respectively (4).
- CFRA projects 32.5% YOY (the annual totals actually don’t add up correctly) and 9.8% per year for ’23 and ’22-’24.
- Value Line projects 13.6% annualized from ’21-’26.
- M* offers a 2-year ACE estimate of 16.3% per year.
I assume long-term annualized EPS growth of 11% based on the following:
- CNN Business reports ACE of 18.8% YOY and 16% per year for ’23 and ’22-’24, respectively (based on 13 analysts).
- MarketWatch projects 16.2% and 14% per year for ’22-’24 and ’22-’25, respectively (14 analysts).
- Nasdaq.com projects annualized rates of 11.1% and 10% for ’22-’24 and ’22-’25, respectively (12, 4, and 3 analysts for ’22, ’24, and ’25).
- YF projects YOY 18.8% and 12.5% for ’23 and ’24, and 14.1% annualized for the next five years (13).
- Zacks projects YOY 15.7% and 9.8% for ’23 and ’24, and 12.6% annualized for the next five years (4).
- Value Line projects 15.5% per year from ’21-’26.
- CFRA projects 32.5% YOY for ’23, 22.7% per year from ’22-’24, and a 3-year annualized EPS projection of 18%.
I project a future High P/E of 49. High P/E has ranged from 32.3 (’15) to 67.4 (’21) over the last 10 years with a last-5-year average of 60.5. The trend continues higher, but I don’t expect this to continue forever. Even the lowest value in the last five years (49.5 in ’17) is outside my comfort zone, but I will use it anyway.
I project a future Low P/E of 27. Low P/E has also trended higher from 19.5 (’13) to 49.8 (’22). The 5-year average is 36.1. Excluding ’21-’22, the highest value in the last 10 years is 29.9 (’19) and the last-5-year average then becomes 27.4.
I project a future low price of $107.40. The default value of $68.80 is over 58% below the previous closing price. I am therefore using the 2021 low, which is still over 35% below current.
All this results in an U/D ratio of 0.8, which puts HEI in the Hold zone. CAR (using forecast High P/E) is 5.1% and PAR (using forecast average P/E) is -0.1%. For me, the latter almost screams sell.
This study feels more aggressive than usual for me and still pegs HEI far from the Buy zone.
I use Member Sentiment to assess margin of safety (MOS). Based on 151 studies over the past 90 days, averages for projected sales, EPS, High P/E, and Low P/E are 10%, 12%, 44.6, and 26.5, respectively. I’m a bit lower on the second and third. Member Sentiment gives the average projected low price as 74.02: close to the default price I rejected. In other words, I overrode to a more aggressive value and still landed far from the Buy zone. Overriding is effectively raising the projected Low P/E so my MOS is probably not much to speak of.
In summary, HEI stock price for the time being seems to have fulfilled its appreciation potential despite solid growth estimates. For a purchase, I’d like the stock to revisit $130 before I reevaluate the projected low price to see if I still feel comfortable with [having raised] it.
Categories: BetterInvesting® | Comments (0) | PermalinkGOOG Stock Study (1-17-23)
Posted by Mark on January 26, 2023 at 07:14 | Last modified: February 10, 2023 14:17I recently did a stock study on Alphabet, Inc. (GOOG) with a closing price of $92.80.
This mega-sized (revenue > $50B) company has grown sales and EPS at annualized rates of 19.2% and 13.2% per year for the last decade. Revenue is up and straight despite 2013 earnings not showing growth until 2018 and beyond. Excluding 2021 (upside outlier), PTPM averages 25.2% for the last five years and is steady over the last 10. This trails peer (stated as META, TCEHY, and SPOT) and industry averages.
Over the last five years, ROE averages 18.4% and is higher than peer and industry averages. Debt-to-capital, under 11% for the last decade, averages 6.6% for the last five years. This is lower than peer and industry averages. Should anyone be concerned about the debt load, interest coverage is a ridiculous 205.6.
M* writes:
> Alphabet is a holding company. Internet media giant Google is a wholly owned
> subsidiary. Google generates 99% of Alphabet revenue, of which more than 85%
> is from online ads. Google’s other revenue is from sales of apps and content
> on Google Play and YouTube, as well as cloud service fees and other licensing
> revenue. Sales of hardware such as Chromebooks, the Pixel smartphone, and
> smart home products, which include Nest and Google Home, also contribute to
> other revenue. Alphabet’s moonshot investments are in its other bets segment,
> where it bets on technology to enhance health (Verily), faster internet
> access to homes (Google Fiber), self-driving cars (Waymo), and more.
I assume long-term annualized sales growth of 7% based on the following:
- CNN Business projects growth of 10% YOY and 9% per year for ’22 and ’21-’23, respectively (based on 43 analysts).
- YF projects YOY growth of 10% and 8% for ’22 and ’23, respectively (31 analysts).
- Zacks projects YOY growth of 10.3% and 7.1% for ’22 and ’23, respectively (9).
- CFRA projects annualized growth of 8.7% and 9.5% for ’21-’23 and ’21-’24, respectively.
- Value Line projects 14% annualized growth from ’21-’26.
- M* offers a 2-year ACE estimate of 6.8% per year.
I assume long-term annualized EPS growth of 6% based on the following:
- CNN Business projects 15.9% YOY contraction and 3.9% contraction per year for ’22 and ’21-’23, respectively (based on 43 analysts).
- MarketWatch projects 2.3% contraction per year and 3.7% growth per year for ’21-’23 and ’21-’24, respectively (48 analysts).
- Nasdaq.com projects annualized growth of 11.8% and 17.6% for ’22-’24 and ’22-’25, respectively (12, 8, and 3 analysts for ’22, ’24, and ’25).
- YF projects 16% YOY contraction for ’22, 10.4% YOY growth for ’23, and 8.9% annualized growth for the next five years (35).
- Zacks projects 16.6% YOY contraction for ’22, 8.1% YOY growth for ’23, and 11.3% annualized growth for the next five years (12).
- Value Line projects 12.7% growth per year from ’21-’26.
- M* has long-term ACE at 13% annualized.
- CFRA projects 3-year annualized EPS growth of 5%.
I project a future High P/E of 27. High P/E has ranged from 29.2 (’18) to 59.9 (upside outlier in ’17) since ’14 with a last-5-year average of 28.9 (excluding the outlier). The trend is down, however.
I project a future Low P/E of 14. Low P/E has ranged from 15.1 (’21) to 42.9 (upside outlier in ’17). Excluding the outlier, the last-5-year average is 18.8. The trend is down.
The projected low price based on these inputs is $70.60, which is about 23% below the previous closing price.
All this results in an U/D ratio of 4, which puts GOOG in the Buy zone down to $98. CAR (using forecast High P/E) is 14.4% and PAR (using forecast average P/E) is 8.3%. I’d like to see PAR higher, but my interpretation also depends on the margin of safety (MOS) built into the study.
To assess MOS, I look at Member Sentiment (MS). 851 studies over the past 90 days indicate projected sales growth, projected EPS growth, and forecast High P/E averages of 11.9%, 13.1%, and 26.9, respectively. My revenue and EPS growth estimates are significantly lower and my High P/E is about the same (27).
I have two issues with this set of MS data. First, no average forecast Low P/E is available. As I scan through the data, I see 12 unreasonable entries in this field including one “NMF.” I wonder if this non-numeric is responsible for why an average could not be calculated. Second, the average low price among these studies is 217 due to some 4-digit values. Being higher than the previous closing price, this would be invalid average. At first I thought people might have used pre-split stock prices, but GOOG stock split more than three months before (Jul 202) the 90-day window begins. Some other explanation must exist.
Regardless of the questionable data, I believe this stock study contains a healthy MOS. Both growth estimates are significantly lower than MS in addition to being lower than every long-term analyst estimate except CFRA (5% EPS growth). Furthermore, Value Line projects a long-term average P/E of 25 compared to my 20.5.
Although the PAR is suboptimal, the MOS gives me confidence in Alphabet’s chances of beating these estimates and realizing stock appreciation more consistent with the forecast High P/E.
Categories: BetterInvesting® | Comments (0) | PermalinkMKSI Stock Study (1-13-23)
Posted by Mark on January 23, 2023 at 07:07 | Last modified: February 9, 2023 14:36I recently did a stock study on MKS Instruments (MKSI) with a closing price of $99.37.
This medium-sized company has grown sales and EPS at rates of 20% and 29.5% per year since 2013. Historical sales and EPS are up and somewhat straight/parallel as EPS has had more of a rocky ride (down in 2016, 2019, and projected 2022). PTPM over the last 10 years has gone up and down between 8.9% and 23.4% with a 5-year average of 19.4%. This is better than peer (stated as TRMG, CGNX, and TDY) and industry averages. ROE over the last five years has averaged 17.3% and is also better than peer and industry averages.
MKSI had no debt until 2016. Over the last five years, debt to capital has averaged 24.8% and been below peer and industry averages. This has all changed with the recent $5.1B acquisition of Atotech. According to M*, MKSI has Current and Quick ratios of 2.8 and 1.6, respectively. While these are healthy, Interest Coverage is a lukewarm 6.5. Value Line lists the latter over 25, but I don’t believe this takes into account the acquisition involving issuance of $4B in debt and 11M shares, which will dilute future EPS.
From CFRA, MKSI is:
> a leading supplier of components and subsystems that measure, control, power, and
> monitor critical parameters of semiconductors and other advanced manufacturing
> processes. The majority of MKSI’s sales are derived from products sold to
> semiconductor capital equipment manufacturers and semiconductor device manufacturers.
> The company’s products are used in the chipmaking process, including depositing thin
> films of material onto silicon wafer substrates and etching and cleaning circuit patterns.”
I will assume long-term annualized sales growth of 7% based on the following:
- CNN Business projects 20.7% growth for 2023 and 13% growth per year for 2022-2024 (based on eight analysts).
- YF projects YOY 17.2% and 7% growth for ’23 and ’24, respectively (nine analysts).
- Zacks projects YOY 17.2% and 7.3% growth for ’23 and ’24, respectively (3).
- Value Line projects 15.7% growth per year from ’21-’26.
- CFRA projects 11.7% and 12.4% growth per year for ’21-’23 and ’21-’24, respectively.
I will assume long-term annualized EPS contraction of 1% based on the following:
- CNN Business reports contraction of 18.7% YOY and 35.5% per year for ’23 YOY and ’22-’24, respectively (based on eight analysts).
- MarketWatch projects annualized contraction of 34.9% and 13.9% from ’22-’24 and ’22-’25, respectively (10 analysts).
- Nasdaq.com projects contraction of 49.3% YOY and 14.8% per year for 2023 and ’22-’24, respectively (5, 5, and 4 analysts for ’22, ’23, and ’24).
- YF projects YOY contraction of 18.7% and 48.8% for ’22 and ’23, respectively, along with 10.2% contraction per year for the next five years.
- Zacks projects 19.2% and 49.3% YOY contraction for ’22 and ’23, respectively (5).
- Value Line projects annualized contraction of 3.5% from ’21-’26.
- CFRA projects annualized contraction of 32.9% and 15% for ’21-’23 and ’21-’24, respectively, with a 3-year EPS growth projection of 2% per year.
I project a future High P/E of 17. High P/E has averaged 25.2 over the last five years with 17.4 being the low end of the last-10-year range (2015).
I project a future Low P/E of 9. Low P/E has averaged 13.3 over the last five years, but 24.6 in 2019 seems to be an upside outlier. Without that, the 5-year average drops to 10.5. I was tempted to use 7.5, but that seems too extreme. 7.5 would eclipse the low end of the last-10-year range (7.9 in 2018) and result in a projected low price of $57.50. This would undercut the 2020 low and be 42% below the previous closing price.
The projected low price based on these inputs is $69, which is 30% below the previous close.
All this results in an U/D ratio of 2, which puts MKSI in the Hold zone down to $91.80. CAR (using forecast High P/E) is 10.7% and PAR (using forecast average P/E) is 5.1%. For me, the latter is too low for a medium-sized company. Payout Ratio for the last five years averaged 15%. I have estimated 10% as 2019’s 31.4% seems like an upside outlier.
I look to Member Sentiment to assess margin of safety. Averages of 239 studies over the past 90 days indicate projected sales growth, EPS growth, High P/E, Low P/E, and Payout Ratio to be 10.1%, 8%, 19.4, 10.9, and 17.5%, respectively. I’m lower across the board and much lower on EPS. Analysts project nothing even close to 8%, which leaves me rather puzzled on that one. Member Sentiment also averages ~$75 for the projected low price, which is higher than mine.
I see a lot of risk with this stock. The debt taken on for Atotech seems to have basically set this company back five years. While saying the acquisition should result in longer-term synergies, Value Line projects long-term EPS growth to be even more negative than my -1%. If the synergies don’t materialize, then MKSI will be left with quite a bill to pay.
The best-case scenario would be resumption of MKSI’s previous EPS trajectory. Because I don’t know if this will come to fruition, I believe the healthy margin of safety is warranted.
Categories: BetterInvesting® | Comments (0) | PermalinkADBE Stock Study (1-12-23)
Posted by Mark on January 20, 2023 at 06:41 | Last modified: February 9, 2023 14:38I recently did a stock study on Adobe Inc. (ADBE) with a closing price of $342.93.
This large-sized company has grown sales and EPS at annualized rates of 17.9% and 44.5% per year since 2013. Historical sales and earnings are up, mostly straight, and parallel with the exception of a slight EPS dip in 2014 and flat EPS from 2020-2022. PTPM averages 32.5% for the last five years while being above the industry average since 2016 and roughly on par with its peer (stated as VMW, MSFT, and SQ) average since 2017. Over the same time period, ROE averages 33.4%.
Debt to capital averages 26.8% over the last five years, which is far below peer and industry averages. Interest Coverage is exemplary at 54 with a 5-year average of 34.
According to CFRA:
> Adobe (ADBE) is the largest provider of applications used to produce visual content, best known
> for its Creative Cloud apps, Photoshop (#1 in photo editing, raster graphics), Illustrator (#1
> in drawing, vector graphics), InDesign (#1 in page layout), and Premiere Pro (#1 in video
> editing). Its apps are used by graphic designers, photographers, publishers, video producers,
> animators, and other creative professionals… ADBE’s apps are also used by students, hobbyists,
> and part-time artists.
With regard to sales growth, CNN Business projects 9.1% for 2023 and 10.8% per year for ’22-’24 (based on 32 analysts). YF projects 9.4% YOY and 12.1% YOY for ’23 and ’24, respectively (28). Zacks projects 9% YOY and 11.1% YOY for ’23 and ’24, respectively (11). Value Line projects 15.5% per year from ’21-’26. Morningstar offers a 2-year ACE estimate of 12.1% per year. CFRA projects 11.4% for ’23 and 11.7% per year for ’22-’24.
Based on all this, I estimate long-term sales with a growth rate of 11%.
With regard to EPS growth, CNN Business reports ACE of 11.5% YOY and 13% per year for ’23 and ’22-’24, respectively (32 analysts). MarketWatch projects 13.3% and 13.4% per year from ’22-’24 and ’22-’25, respectively. Nasdaq.com projects 13.9% YOY and 12.3% per year for ’24 and ’23-’25, respectively (11, 10, and 1 analyst for ’23, ’24, and ’25). YF projects 11.7% for 2023, 14.6% for 2024, and 13.6% per year for the next five years. Zacks projects 11% for 2023, 13.7% for 2024, and 13.2% per year for the next five years (28). Value Line projects 13.7% per year from ’21-’26. M* has long-term ACE at 14.1% per year and 11% per year from its analyst. CFRA provides a 3-year projection of 13% per year.
Based on all this, I estimate long-term earnings with a growth rate of 11%.
High P/E has ranged from 47.9 (2016) to 140 (2014) over the last 10 years. The last five years have averaged 58.4. I project a long-term High P/E of 47.
Low P/E has ranged from 23.6 (2020) to 101.8 (upside outlier in 2014). The last five years have averaged 31.8. I project a long-term Low P/E of 23.
I am sticking with the default long-term projected low price of $232.30, which is 32% below the previous closing price.
All this results in an U/D ratio of 4.1, which puts ADBE in the Buy zone. CAR (using forecast High P/E) is 23.6% and PAR (using forecast average P/E) is 11.7%.
In order to assess margin of safety, I look to Member Sentiment. Averages of 662 studies over the past 90 days indicate projected sales, EPS, High P/E, and Low P/E of 13.1%, 13.1%, 42.4, and 29.4, respectively. My growth rate estimates are lower and although my projected High P/E (47) is higher, my average P/E (35) is slightly lower than Member Sentiment (35.9) and Value Line (36). Although of questionable importance due to unknown correlation with other inputs, my projected low price of $232.30 is much lower than the average projected low price of $261.45. This could bias my study toward Sell.
A margin of safety gives me added confidence that the company can outperform relatively conservative inputs.
Categories: BetterInvesting® | Comments (0) | PermalinkDebugging the Missing Time Spread Backtrades (Part 3)
Posted by Mark on January 17, 2023 at 06:41 | Last modified: June 27, 2022 19:03I will continue with the debug journey after explaining the complexity of date formats.
As discussed near the end of this post, the date field is in “number of days since Jan 1, 1970.” Although unreadable on its own, I keep this format to check the data file. This can also be subtracted to get difference in days.
While the Python in the link converts these dates to a common format, I have also needed to convert in reverse. I came up with the following for this purpose, which [I think] needs time and datetime modules to work:
int( time.mktime ( datetime.datetime.strptime ( summary_results [ “Trade End” ].iloc [ -4 ], \
“%Y-%m-%d” ) . timetuple ( ) ) / 86400 )
The code takes YYYY-mm-dd as input and outputs days since 1/1/70. I also started to log row numbers in btstats to better identify what rows are matching should I need to refer back to the data file.
I think I am better prepared to approach this debug now that I can convert date forward and backward.
Let’s return to the end of Part 2 where I discovered no apparent problem is being had with the number of matching options.
My next thought was that maybe the particular spread is not being selected from the encoded data. I therefore moved the debug line just below the block where short option variables get assigned:
for i in range ( len ( dte_list ) ):
if dte_list[ i ] >= ( 30 * mte ):
Again, dates_without_enough_matches is empty. So far, things are seeming to work just fine when I know they’re not.
I then added these lines near the top before the conditional block begins to determine control branch:
if current_date != current_date_prev: #debug
print ( f ‘ current_date is { current_date }, common date is { datetime.utcfromtimestamp ( current_date * \
86400 ).strftime( “%Y-%m-%d” ) }, trade status is { trade_status }, and control flag is { control_flag } . ‘ )
current_date_prev = current_date
The idea here is to print out a trace line every time current_date changes (and to update current_date_prev to current_date).
Take a close look at two anomalies that stick out in the following output segment:
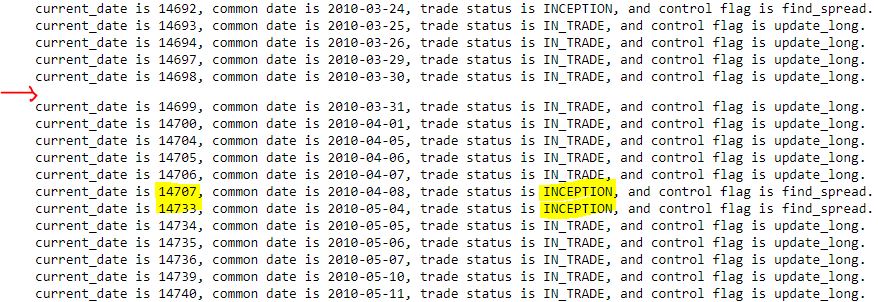
First, I am not sure why I get the occasional blank line as indicated by the red arrow. Current date is always five digits, common date is always the same format, trade_status is at most nine characters, and control_flag is always 11 characters. I get roughly 3500 total trace lines (from 2007 through 2021). In case the trace may occasionally exceed one line in length (thereby showing up as a blank second line), I added ‘123456789’ to the end expecting that I might see many more blanks (or second lines with some of those extra digits). This has no effect; the output looks the same.
While the first anomaly remains unresolved, the second anomaly (yellow) is more relevant. Per this this fourth-to-last paragraph, I am getting some consecutive trace lines printing out with ‘INCEPTION,’ which may indicate missing trade dates. 26 days are skipped from 2010-04-08 to 2010-05-04, though, when I would expect a trace line for each date in the data file.
What is going on here?
Categories: Python | Comments (0) | PermalinkDebugging the Missing Time Spread Backtrades (Part 2)
Posted by Mark on January 12, 2023 at 06:22 | Last modified: June 27, 2022 13:16By way of review, the idea is to log relevant variables in places where spreads could or should be found and aren’t. I left off discussing where in the program I need to insert code to do this.
In case I want to log in the ‘find_spread’ branch, let’s review the sub-branches:
- if int(float(stats[2])) > 200:
I don’t want time spreads with options > 200 DTE. Skipping these rows is expected and no reason to log variables. - elif len(dte_list) == 0 and if int(float(stats[6])) % 25 == 0 and if int(float(stats[6])) > float(stats[3]) and int(float(stats[6])) – float(stats[3]) < 26:
This sub-branch appends data for the option with first matching strike price. It’s always possible that no match will be found in any row for a particular historical date, which to me would suggest an incomplete data file. - elif int(float(stats[2])) == dte_list[0]: continue
This skips rows [on same current_date and] with DTE equal to a previously-matched DTE. Nothing to log here. - elif int(float(stats[1])) == current_date and if int(float(stats[6])) == strike_price:
This sub-branch records DTE for subsequent strike price matches. The different DTE represents a different expiration month. If the previously-matched strike price is not matched here, then it may be evidence of an incomplete data file. - else:
This sub-branch should be executed only after the program has gone through all options on current_date. If no spread has been found, then a skipped trading day will result and len(dte_list) should be < 2. Alternatively, a found spread(s) may not selected in this sub-branch. Either way, logging relevant variables here seems to make good sense.
What are the relevant variables to log?
I increasingly suspect len(dte_list) should be looked at first. On any given day it should be > 2 for at least two matching options (one potential spread). As a first attempt, I will append current_date to a new list dates_without_enough_matches at the top of the ‘find_spread’ ELSE sub-branch for any day that does not meet this criterion.
Surprisingly, the list is empty! This suggests failure to match strike price is not the issue.
Just to be transparent, I am now moving the following line to the end of the ‘find_spread’ ELSE sub-branch:
current_date = int(float(stats[1])) #updating
Since the previous elif executes on the same current_date (and strike price match), by implication this sub-branch takes place on the next day. Updating current_date at the beginning of this sub-branch forced me to use “current_date – 1” in following lines, which may not be accurate in case of weekends, holidays, etc. Updating at the end eliminates this problem. While not part of the current debugging effort, in scrutinizing this part of the program I saw opportunity for improvement.
I will continue next time.
Categories: Python | Comments (0) | PermalinkDebugging the Missing Time Spread Backtrades (Part 1)
Posted by Mark on January 9, 2023 at 06:14 | Last modified: June 24, 2022 11:25Because the current debugging effort is challenging, today I want to put my thoughts to computer screen and push forward to find out why the backtester is missing trades (last discussed here).
Need some juice today? Let’s get in the mood with this (thanks Frida!).
The first thing I should do is run the backtest a couple more times to make sure the values from the table in the previous post are repeatable. I would be more concerned if trades get missed randomly than regularly.
Next, I want to know the values of all relevant variables when trade skipping takes place. I can then trace what I expect should be the logic through the program to see if the results actually match.
Relevant variables can be monitored in one of two ways.
First, I can create a variable containing current_date minus previous trade ending date and raise an exception > 5. This would limit study to one case at a time, which should be sufficient if the cause of missing trades is uniform. Going this route, I need to write the dataframes to .csv and file.close() before raising an exception, which will immediately halt the program. The former will allow me to view the entire dataframe in Excel, which is easier than viewing with Jupyter Notebook. file.close() will avoid the annoying “file in use” warning when I try to open the file after an exception has been raised.
The second way to monitor relevant variables is to let the program run all the way through and collect data on the variables for every trading day without a position. Going this route, I can add code to write to btstats per usual. Skipped days would be evident as consecutive rows labeled ‘INCEPTION.’ I can also scroll down to the particular dates I anticipate this to occur, where I would expect to see mostly zeros with all variables reset.
I’m not sure btstats contains all the relevant variables I want to monitor, which I need to think carefully about to determine. Should this be true, I can always create another dataframe with relevant variables as column names.
The next thing I need to figure out is where in the program I need to call for the relevant variables to be logged. I feel confident to say it should come when control_flag is ‘find_spread.’ That is, after all, when the program is iterating through days without any positions. I also think it makes sense to log relevant variables when spread legs are not encoded.
I will continue next time.
Categories: Python | Comments (0) | PermalinkFinal Word on Formatting Datetime Axes
Posted by Mark on January 6, 2023 at 06:42 | Last modified: June 22, 2022 10:26Today I will pick up plotting datetimes with uniform tick labels.
I’ve learned this is not as difficult as I may* have suspected. The x-coordinates are given in trade_list, which is a list of strings. I need datetimes, which can be created like this:
trade_dates_as_datetime = [datetime.strptime(i, “%Y-%m-%d”) for i in trade_list]
Alternatively, I can ago back to pd.date_range() (introduced here) and include the first/last [string] dates from trade_list:
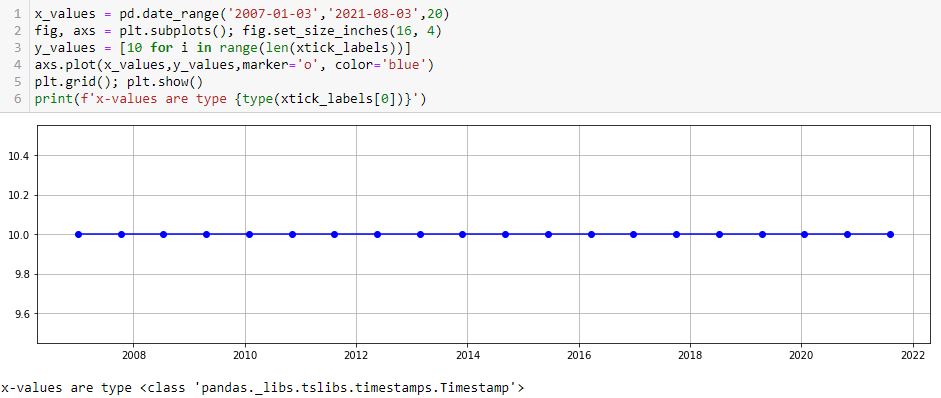
As mentioned in that earlier post, these x-values are type pd.Timestamp, which I believe is a datetime.
One thing I don’t like is the first major tick printing after the first point. I can remedy with the following:
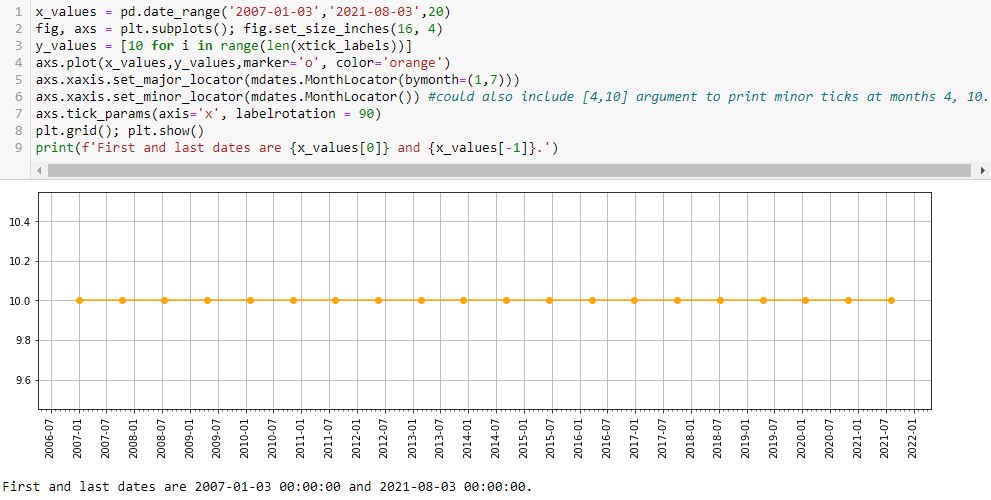
L5 prints major ticks at months 1 and 7. The first (last) major tick is the one preceding (following) the first (last) data point at 2006-07 (2021-08). This is default and leaves ample room to be aesthetically pleasing.
L6 prints minor ticks every month. If so desired, I could specify particular months by including them as a list (e.g. [4,10] would place a minor tick at the other two quarters).
Interestingly, if I put bymonth=(2,6) in L5, then I get something looking like the nasty asymmetry seen in this lower plot:
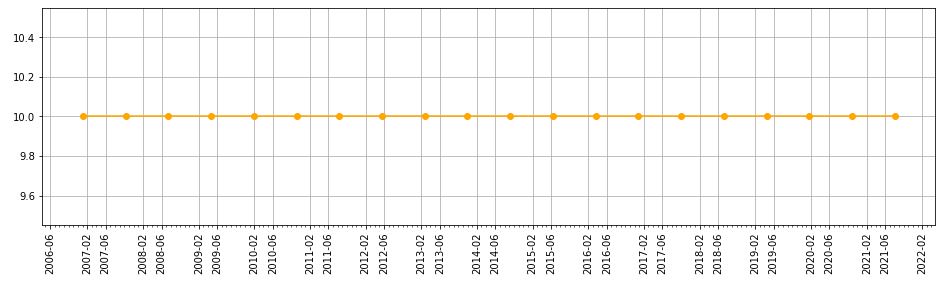
This asymmetry is with major ticks plotted at the same months, though, whereas the earlier one results from major ticks being plotted on the first and 22nd of every month.
With L7 allowing me to adjust rotation, I can now customize about everything I would want on this graph.
Oh—what if I want to put a three-letter month instead of number? I can add this line:
axs.xaxis.set_major_formatter(mdates.DateFormatter(‘%b-%Y’))
Editing rotation to 45 [degrees] produces this:
* — “May” because this has confused and led me in a complete circle to find a complete solution.
Categories: Python | Comments (0) | PermalinkIT Stock Study (2-14-23)
Posted by Mark on January 3, 2023 at 07:07 | Last modified: March 9, 2023 11:05I recently* did a stock study on Gartner Inc. (IT) with a closing price of $351.46.
CFRA writes:
> Gartner, Inc. (IT) is one of the world’s largest research and
> advisory providers. [Gartner] supplies business leaders with
> indispensable insights, advice, and tools to achieve their goals and
> help facilitate business outcomes. [Gartner] currently services
> more than 15,000 organizations in over 100 countries worldwide.
This medium-sized company has grown sales and earnings at annualized rates of 13.6% and 20.7% over the last 10 years, respectively. Lines are mostly up, straight, and parallel except for EPS in ’17-’18 (likely due to TCJA) and sales in ’20. Over the last 10 years (excluding ’17), PTPM has ranged from 4.6% (’18) to 20.5% (’21) with a last-5-year average of 11.7%. This leads peer averages and is roughly even with industry averages. Gartner has demonstrated some wild ROE swings ranging from -1819% (’16) to 226.9% (’21) with a last-5-year average (excluding ’21 and -1215% for ’22) of 21%.
Over the last five years, Debt-to-Capital averages an uncomfortable 78.1%, which is higher than peer and industry averages. Interest Coverage is 8, but was less than 4 from ’18-’20. Current and Quick Ratios don’t alleviate much concern at 0.64 and 0.51, respectively. Value Line gives Gartner a B++ for Financial Strength “despite its sizeable debt load.” Rather than pay down debt, the company bought back $1B in stock in ’22, which is about equal to its TTM FCF.
I assume long-term annualized sales growth of 7% based on the following:
- CNN Business projects 7.3% YOY and 8.7% per year for ’23 and ’22-’24, respectively (based on 8 analysts).
- YF projects YOY 8.3% and 10.3% for ’23 and ’24, respectively (9 analysts).
- Zacks projects YOY 8.7% and 10.6% for ’23 and ’24, respectively (3).
- Value Line projects 10% per year from ’22-’27.
- CFRA projects 7.5% YOY and 8.7% per year for ’23 and ’22-’24, respectively.
I am forecasting on the low side.
I assume long-term annualized EPS growth of 6% based on the following:
- CNN Business projects 16.3% YOY contraction and 1.5% contraction per year for ’23 and ’22-’24, respectively (based on eight analysts), along with a 5-year annualized growth rate of 6.2%.
- MarketWatch projects 4.5% and 8.2% growth per year for ’22-’24 and ’22-’25, respectively (10 analysts).
- Nasdaq.com projects 18.2% YOY growth and 17.3% growth per year for ’24 and ’23-’25, respectively (4, 4, and 2 analysts for ’23, ’24, and ’25).
- Seeking Alpha projects 4-year annualized growth of 13.4%.
- YF projects 16.3% YOY contraction and 16% YOY growth for ’23 and ’24, respectively (9), along with 5-year annualized growth of 6%.
- Zacks projects 15.8% YOY contraction and 18.2% YOY growth for ’23 and ’24, respectively (4), along with 5-year annualized growth of 6.5%.
- Value Line projects annualized growth of 10.5% from ’22-’27.
- CFRA projects contraction of 19.4% YOY and 4.6% per year for ’23 and ’22-’24, respectively, in addition to 5% annualized growth from ’21-’24.
I am forecasting at the bottom of the five-long-term-estimate range (mean 8.5%).
My Forecast High P/E is 35. Excluding ’17-’18, which were outliers over 100, high P/E went from 37 (’13) to 67.1 (’19) and has now come down to 35.9 (’22). The last-5-year average (excluding ’18) is 45.7. I am forecasting just below the range.
My Forecast Low P/E is 23. Excluding ’17-’18, which were outliers over 80, low P/E went from 24.1 (’13) to 47.9 (’19) and has now come down to 22.2 (’22). The last-5-year average (excluding ’18) is 28.1. I am forecasting at the bottom of the range.
My Low Stock Price Forecast (LSPF) is the default value of $229.80. This is 34.6% below the previous closing price and 3.8% above the 52-week low.
All this computes to an U/D ratio of 1.0, which makes IT a HOLD. The Total Annualized Return is 5.5%.
M* categorizes Gartner with a Wide economic moat (despite offering only quantitative analyst coverage).
PAR (using Forecast Average, not High, P/E) is 2%, though, which is much lower than desired for a medium-sized company. This is not a huge surprise as the stock is up almost 38% in the last 4.5 months.
To better understand margin of safety (MOS) in this study, I look to Member Sentiment (MS). Out of only 13 studies over the past 90 days (my own excluded), projected sales growth, projected EPS growth, and Forecast High P/E average 10.6%, 10.7%, and 45.6, respectively. My inputs are all lower. MS is quirky on Forecast Low P/E as three studies have values over 280. Excluding these, the average (10 studies) is 28.6, which is higher than mine. Value Line projects an average annual P/E of 30.5, which is higher than MS (37.1) and slightly higher than mine (29). All this is indicative of a healthy MOS.
What is not lower is my LSPF. MS has this 21% lower at $182. The ’21 low stock price was $149. In this regard, I don’t find MS to be unreasonable. It does imply a Forecast Low P/E of 18.2, however. As my P/E range is somewhat depressed already, I see no need to lower it further.
Somewhere and sometime, I think there’s a discussion to be had with regard to LSPF.
For any growth stock looking five years out, I never actually anticipate a future 52-week low (i.e. LSPF) to be lower than the current stock price. If I do, then I’m really predicting something horrible to happen to the company (e.g. losing its growth entirely), a stock market crash like we have never seen, a prolonged recession not seen in this country since the 1930’s (?), or some other Black Swan that I can’t imagine.
Consider a hypothetical range for LSPF from 20% below the last close to 30% [or more] below. Something seems contradictory about the fact that this can dramatically affect BUY vs. HOLD decisions today even though I fully expect stock price in five years to comfortably exceed the entire hypothetical range.
I’d love to hear some more experienced members weigh in on this.
*—Publishing in arrears as I’ve been doing one daily stock study while posting only two blogs per week.