Time Spread Backtesting (Part 2)
Posted by Mark on December 27, 2022 at 06:25 | Last modified: June 23, 2022 14:26Last time, I began easing into time spread backtesting with my Python automated backtester by discussing trade verification. Before getting into that, I need to flush out a couple bugs in the program.
Because sudden equity jumps in the first graph may be seen as other anomalous prints on the other three graphs, I will begin with the three outlier position prices seen on the second graph. The first appears to be ~$30 around the beginning of Apr 2013. As an original price, this should be visible in the summary file:
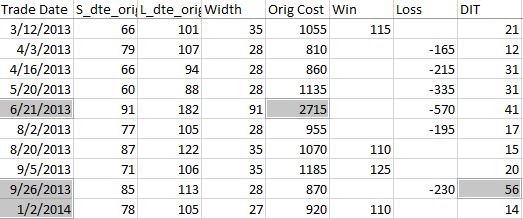
Although the trade in question is obviously from 6/21/13 ($27.15 * 100/contract = $2,715 original cost), it plots closer to the beginning of Apr 2013. I think the problem is everything I did here with regard to “plots the evenly-spaced date labels at evenly spaced locations on the x-axis.” Unfortunately, the trades are not evenly-spaced. Although I want the tick marks to be evenly spaced in time and distance across the graph, I want the x-values of the points to correctly match the x-axis.
This will need fixing.
Another problem regards the final trade of 2013 beginning Sep 26 and lasting 56 days. Rounding off, the next trade should begin around Nov 26 (two months later). Surprisingly, the next trade does not begin until Jan 2, 2014. What happened?
I am tempted to think any open trade at the end of a year gets erroneously junked in favor of a new trade beginning first trading day of the following year due to an iteration technicality.
However, the anomaly does not seem to reduce to anything that consistent. It does not repeat for 2014 (trade ends Dec 19 with next trading starting Dec 31). It is not applicable for 2015 (Dec 22 trade correctly carries over to Jan 7, 2016) or beyond. Going backward from 2013, the anomaly does present in 2012 and in 2010.
To pin this down more accurately, I replaced the Trade Date column in summary_file with Trade Start and Trade End columns. In Excel, I then subtracted the previous Trade End from Trade Start and sorted this Date Diff column from highest to lowest. Because I was missing the previous trade ending date, I inserted that as a new column making sure to Paste Special by values to prevent sorting triggering a recalculation:
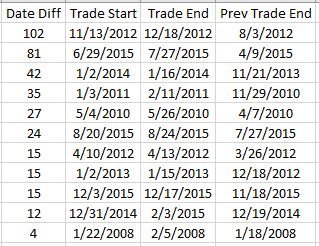
Date differences of four or less are within normal limits. One would be a new trade starting on a weekday after the previous trade ended yesterday. Two could be a weekday market holiday such as Independence Day coming in between. Three would be a new trade starting on a Monday after the previous trade ended on Friday. Four would be a trade ending on a Thursday or Friday with new trade starting the following Monday or Tuesday due to a Friday or Monday market holiday.
I could even stretch to explain a five in case the market were closed for an extended period. For example, due to Hurricane Sandy the markets were closed Monday, Oct 29, and Tuesday, Oct 30, 2012.
As shown above, the list skips from four straight to 12. This defies any explanation. If the data files are clean, then I expect entries and exits on back-to-back trading days every single time.
There’s something going on…