The Risk of Going Naked (Part 2)
Posted by Mark on February 27, 2017 at 07:26 | Last modified: December 22, 2016 11:23I recently presented some excerpts from an online forum regarding the risk of trading naked options.
This is the kind of sobering talk that makes me uncomfortable with leverage. Regardless of the extent to which market turmoil occurred in the backtesting period, a severe enough market crash could always bring to fruition something worse.
Without leverage, drawdowns tend to be minimal, risk of Ruin is relatively small, and quality of sleep is restful throughout. While I am tempted to take advantage by boosting position size for better total return while maintaining equal or lesser drawdowns, doing so means adding leverage right back into the equation.
If I want to hedge myself against the most extreme moves then I can buy [cheap] insurance. This will increase return on capital. This will also save me if the catastrophic market crash actually takes place, which has anecdotally happened every 5-7 years throughout the current century. The market will more commonly fall several percentage points and level off or reverse higher. This magnitude of correction is nowhere near that required to realize max loss on the hedged naked puts (vertical spreads). The breakeven point would require an even larger drop since the insurance is not free.
And while that max loss is much lower than the “undefined risk” of naked puts, the loss is probably catastrophic either way. I’m tempted to backtest this and look at different position sizing but the sample size would be too small to allow for any meaningful conclusions.
I think it would be nice to insure the extremes and be able to claim “were the market ever to crash to zero, you would be covered [or even profit].” A total market crash is what doomsday forecasters love to prognosticate. Hedging against this is always possible with options but it comes at the cost of lower profitability during normal market action. My preferred solution is to allocate no more than X% of one’s total portfolio to this sort of “unlimited risk” trading.
Allowing for the possibility of catastrophic loss and managing risk by position sizing is, in my mind, what has relegated a strategy like this to accredited investors and hedge funds.
Then again, this argument could be easily contested. Common stocks—purchasable with leverage to investors who are not accredited—also go to zero (e.g. bankruptcy). While baskets of stocks rarely go to zero and indices have never gone to zero, all of the above have suffered catastrophic losses: pick any stock market crash. Limiting total portfolio allocation, therefore, is probably smart whether dealing with naked puts or long stock.
In the eyes of the regulators, naked puts would probably be okay for anyone as long as position sizing is based on Reg T margin requirements (i.e. cash-secured).
Categories: Option Trading | Comments (0) | PermalinkFooled by Randomness
Posted by Mark on February 24, 2017 at 07:06 | Last modified: November 8, 2016 15:09William Bernstein, co-founder of Efficient Frontier Advisors and author of several books, was interviewed in the September 2016 issue of the AAII Journal. He made an interesting point that reminded me of Nassim Taleb’s book Fooled by Randomness:
> …never confuse outcome with process. By that
> I mean that there is a lot of noise in investing,
> and it is perfectly possible to have a bad
> strategy or be a stupid investor… and do very
> well. People who buy lottery tickets occasionally
> win. Having a good strategy and not having a good
> result happens all too frequently as well. The
> essential thing people really don’t understand
> about finance is that there is an enormous
> amount of noise, particularly over the short term.
The take-home message for me is the first line: never confuse outcome with process. The stock market goes up most of the time. It may even go up for years. When it corrects, large sums of money can be lost in short periods of time. One must be careful not to lose all that has been gained or more.
While the market is going up, people are happy with their strategies and impressed with themselves. Many think they have skills and have attained a level of expertise. Remember the old saying “a rising tide lifts all boats,” though, which suggests most stocks rally when the market moves higher. Anyone participating during these bull market periods is likely to make money regardless of strategy. Ego can really come into play when people dramatically increase position size. This inconveniently happens all too often just in time for the next market correction or crash.
Trading system development methodology is designed to determine whether a profitable system is attributable to an effective strategy or simply a matter of luck. The process is designed to screen out the luck factor by studying large sample sizes, maximum drawdowns, employing Monte Carlo simulation, and walk-forward analysis. This is challenging work because it requires coding skills and software know-how in addition to theoretical understanding.
The cost of mistaking random luck for skill worthy of confidence is an increased likelihood of catastrophic loss when the next bear market rears its ugly head: something none of us look forward to.
Categories: Wisdom | Comments (0) | PermalinkThe Risk of Going Naked (Part 1)
Posted by Mark on February 21, 2017 at 06:35 | Last modified: December 14, 2016 16:13Today I want to step back and review the risk of trading naked options.
The following exchange occurred in a Yahoo! Group I followed back in May 2015. R started it out:
> I think anyone selling options should read
> The Black Swan by Nassim Taleb to understand
> low probability, high impact events. This is
> the risk with leveraged naked option selling.
> To give an extreme example, nobody in their
> right mind plays Russian Roulette with a gun that
> has a barrel with 99 empty chambers and just
> one bullet. Even though you are “correct” 99% of
> the time, when you are wrong it’s game over.
V wrote:
> I was in no way doubting your numbers. I just
> wanted to know if you were writing closer or
> using more margin or different underlyings.
> I apologize for the misunderstanding.
V also wrote:
> It’s all good. I appreciate the openness of
> the group and the desire to educate and
> enlighten everyone. The returns are beating
> all hedge funds, which is amazing to me. I
> hope I didn’t come off as skeptical.
I responded:
> You should be skeptical, V. Recent posts by R
> about naked option selling raise an extremely
> good point and very scary possibility for those
> trying to make a living by doing this. The other
> side of the coin is that this work should not
> simply be dismissed because it’s naked option
> selling. There’s plenty of reason to think that
> it can work given particular management
> techniques and strategies: much of which are
> discussed in this group.
>
> Another reason to be skeptical is that even
> people who report solid returns are sometimes
> “under the influence.” They may never have
> seen significant downside and may be ignorant
> as to how positions are affected when volatility
> truly explodes. People might report returns
> accurately but, as R noted, if those returns are
> annualized and we have a 2 SD downmove a
> couple months later then those annualized
> returns will never be realized.
>
> Whenever people start talking or writing as if
> anything in trading is a sure thing or an ATM
> machine, I become suspicious. I believe that’s
> when you should start asking what they’re
> missing or where they are wrong. If you
> can’t find anything then maybe they are truly
> onto something.
I will continue next time.
Categories: Option Trading | Comments (1) | PermalinkDynamic Iron Butterflies (Part 5)
Posted by Mark on February 16, 2017 at 07:28 | Last modified: February 2, 2017 09:40Better execution can definitely improve profitability of the dynamic iron butterfly (DIBF). This makes me wonder about placing the trade and just leaving it to sit until filled.
Analysis of the maximum adverse excursion (MAE) can help to study this. A losing trade could almost always have been filled at a better price. Out of 3968 backtrades, 736 never get down more money than they are at trade inception. Minute-to-minute volatility in the markets is much greater than day-to-day (seen in my EOD backtest) volatility, which provides hope that most of the 736 would eventually fill. This is no guarantee, however, and 18% includes a big opportunity for otherwise winning trades to go unfilled thereby depressing total return.
Here is the complete MAE distribution across 3,968 backtrades:
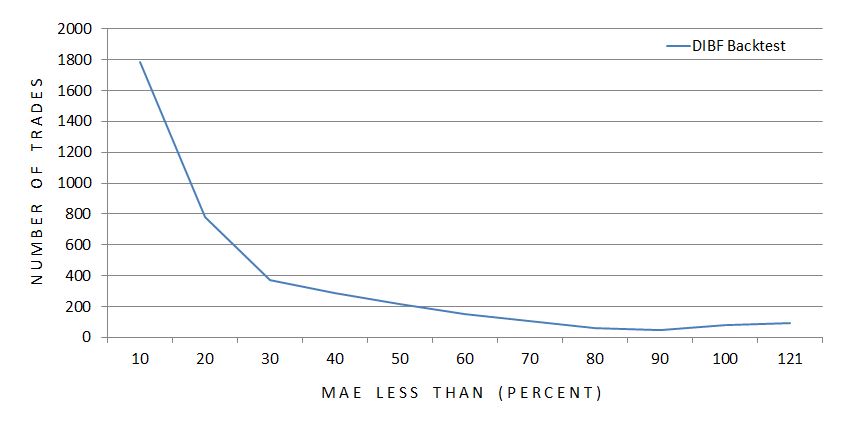
The x-axis indicates the maximum MAE seen for each particular grouping of trades. The first data point includes all trades with MAE less than 10%, the second data point includes all trades with MAE of 10% up to 20%, etc.
The graph illustrates a majority of trades never get down a whole lot.
Here’s the same information packaged somewhat differently:
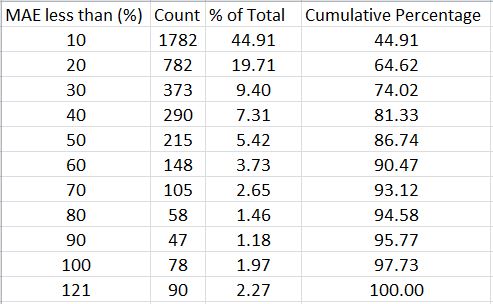
With a profit target of 10%, over 64% of all backtrades never get down more than 20% and over 86% never get down more than 50%.
This suggests a potential benefit to using a stop-loss. I still need to better understand how many winners would be affected, though. How does the MAE distribution compare between winning and losing trades?
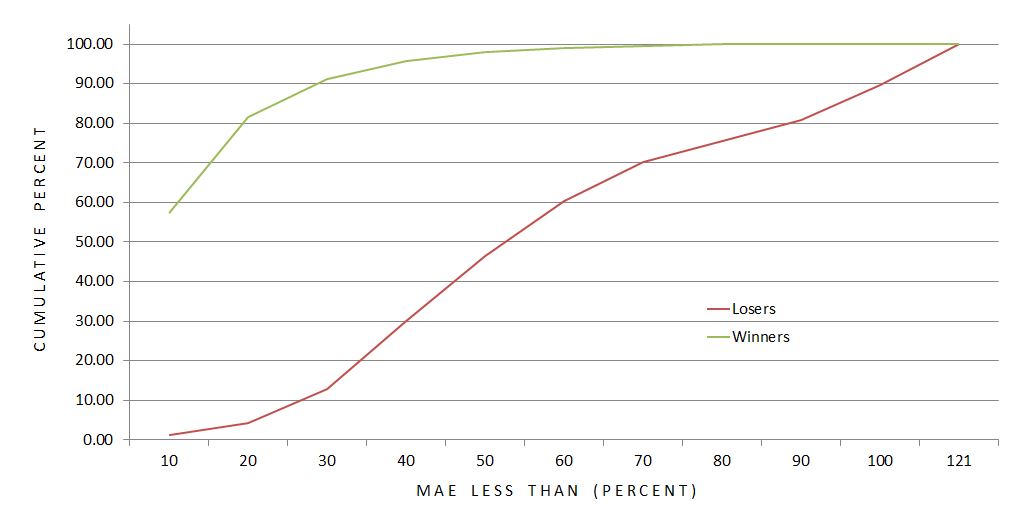
This graph shows the difference to be significant. Over 91% of winners never get down more than 30% compared to just under 13% of losers. The average MAE for winning (losing) trades is 12.9% (57.9%).
Over 98% of winning trades are never down more than 50%.
Is a 50% stop-loss worthwhile?
The cost is conversion of 59 winning trades into certain losers ranging anywhere from 50-90%.
The benefit is an opportunity to save money on 467 trades that would otherwise lose up to ~100%.
This sounds like a reasonable trade-off to me since the number of trades potentially benefitting is eight times the number to suffer a worse fate. And even if the overall return does not improve, cutting down the biggest losers would still reduce the standard deviation of returns, which is a measure of risk.
Confirming this would involve collecting revised loss data on 526 backtrades with MAE over 50%. I should also backtest the surrounding parameter space by checking stop-loss thresholds like 10%, 20%, etc. This could be an awful lot of work…
But who ever said making a business out of trading should ever be easy?
Categories: Backtesting | Comments (1) | PermalinkDynamic Iron Butterflies (Part 4)
Posted by Mark on February 13, 2017 at 06:56 | Last modified: January 6, 2017 10:24My last post was a hodgepodge of information about the dynamic iron butterfly (DIBF) backtest and I’m going to pick up right where I left off.
The differential loss data compounds my concern about the backtest being a combination of two different trades. As a combination, it’s hard to tell to what extent the “dynamic” [put credit spread (PCS)] aspect contributes to the profitability. Worrisome is the fact that 77% of the losses are to the downside: exactly where the “dynamic” aspect can result in greater loss. Let’s take a closer look at the loss distribution:
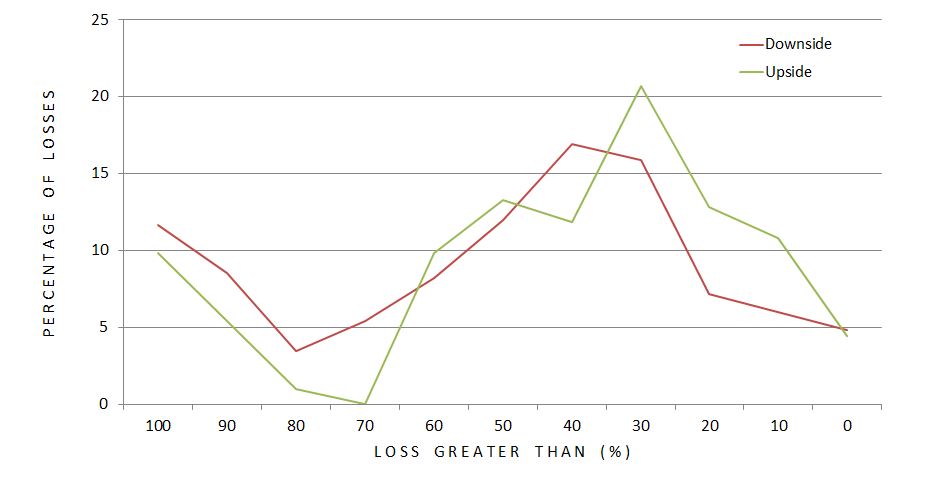
Each data point represents what percentage of upside (green) or downside (red) losses occurred at different magnitudes of loss (ROI %). The difference does not look as dramatic as I expected but it still may be. A greater percentage of downside losses occurred at loss levels exceeding 70% ROI. Furthermore, 66% (51%) of downside (upside) losses were worse than 40%. This is a rather large difference especially considering the fact that 77% of all losses were to the downside.
Plotting number of losses, rather than percentage, looks like this:
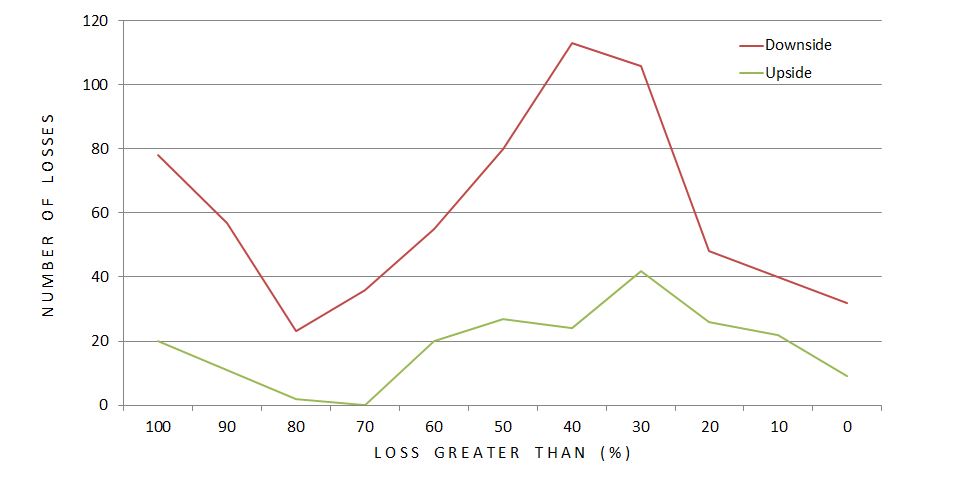
The difference looks more dramatic here. Total dollars lost would mimic this.
While the PCS is an obvious culprit when studying directional loss distribution, we cannot forget that it benefits the position to the upside. More than just “upside,” the PCS benefits the position as long as the market does not fall more from the DIBF short strike than the width of the call credit spread. This is the “dynamic” portion. I don’t need to do the computations to know this is the vast majority of winners. In fact, this will always be the case:
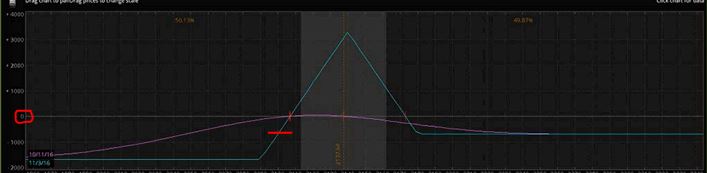
If the market falls an amount equal to the width of the call credit spread, this trade will be losing money as evidenced by the intersection of the red horizontal hashmark and blue line being below zero profit (circled in red on the y-axis). That would be my reason for hypothesizing all winners will have fallen less than this amount even though before expiration, unrealized loss is not as extreme (e.g. purple curve).
In any case, what would be interesting to know is how DIBF performance compares to a symmetrical iron butterfly (no PCS). This is definitely a future direction for study.
Next on the docket, though, is analysis of maximum adverse excursion.
Categories: Backtesting | Comments (0) | PermalinkDynamic Iron Butterflies (Part 3)
Posted by Mark on February 10, 2017 at 06:58 | Last modified: December 7, 2016 15:25In the last post I suggested overstatement of transaction fees may have been the difference between a winning and losing dynamic iron butterfly (DIBF) backtest.
I crunched the numbers and can now speak definitively to that hypothesis. Here are the overall backtested trade statistics recomputed for different transaction fees (TF). The second column is the $0.26/option used in the original backtest:
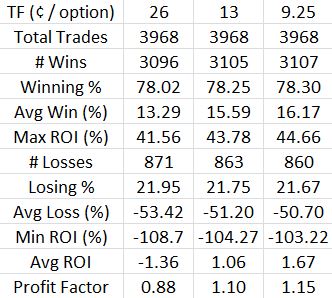
Indeed, lowering the transaction fees does make this a profitable trade. While the profit factor of 1.15 is not nearly as impressive as the 1.58 seen for naked puts, it is at least profitable.
Put another way, these numbers provide reasonable doubt as to whether the DIBF is actually a losing trade. My preference is still to bias slippage in favor of loss and regardless of the heavy slippage applied, I want to see if I can do anything to boost the average trade and make this strategy more encouraging.
Doing the backtest helped me discover two potential problems.
First, the DIBF has a varied reward-to-risk ratio (RRR). I noticed at times the RRR was downright rotten (less than 1.0). This could be improved by decreasing the width of the put wing. I suspect a lower RRR might lead to a lower winning percentage and a longer time in the trade because the T+0 curve is particularly steep to the downside in relation to the limited potential profit at expiration. RRR was not tracked in the current backtest so my suspicion remains speculative.
My second issue with the strategy is the fact that it is a combination (of an iron butterfly and put credit spread). Selling an OTM long put and buying one further OTM—a credit spread—is what makes it “dynamic.” Before delving too much into the results of a combination strategy, I feel inclined to first study a plain iron butterfly. I may or may not do that before having the confidence to trade the DITM regularly.
Thanks to Pete_UK for helping me calculate the directional breakdown of losses in a hurry:
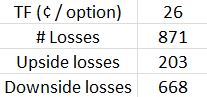
This compounds my concern about adding a put credit spread to the iron butterfly.
Categories: Backtesting | Comments (3) | PermalinkDynamic Iron Butterflies (Part 2)
Posted by Mark on February 7, 2017 at 06:57 | Last modified: December 6, 2016 11:14Last time, I presented the overall trade statistics for my first study of dynamic iron butterflies (DIBF). The results were not pretty. Today I want to address the impact of transaction fees (slippage + commission).
I have previously discussed how transaction fees can make or break a study. I subtracted $0.26/contract because I was backtesting some expensive, at-the-money options and when I have to estimate, I prefer to bias in favor of loss. Despite only trading a handful of live butterflies to date, I have never paid more than $0.13/contract in transaction fees (sometimes $0.06). Fast-moving markets could take more than $0.26 but such adverse conditions are rare.
Let’s compute how an overestimation of transaction fees may have affected results. The mean margin requirement (MR) across all trades was $4,878. I subtracted $26 * 8 = $208 from each trade for transaction fees. Cutting that by 50% adds $104 / $4,878 * 100% = 2.1% ROI to each trade. The average trade lost 1.4% so this modification makes the backtested DIBF a winning trade (+0.7%). If even 50% is estimating high then I should reduce transaction fees between $104 – $156. If I use the middle of that range then the average trade gains 1.2%.
Transaction fees alone can make the difference between a 1.4% loss and a 1.2% profit per trade. Financially speaking, those are worlds apart. Thinking about how many traders omit transaction fees entirely for the sake of simplicity just boggles my mind. No wonder so many statistics suggest up to 90% of traders fail within the first five years.
These calculations are based on averages but the exact MR should be considered. Reducing slippage by $52 impacts a $2600 trade twice as much as a $5200 trade. More expensive trades occur in higher IV, which occurs less frequently. I would therefore hypothesize lower MR trades to dominate the distribution, which might boost average ROI further:
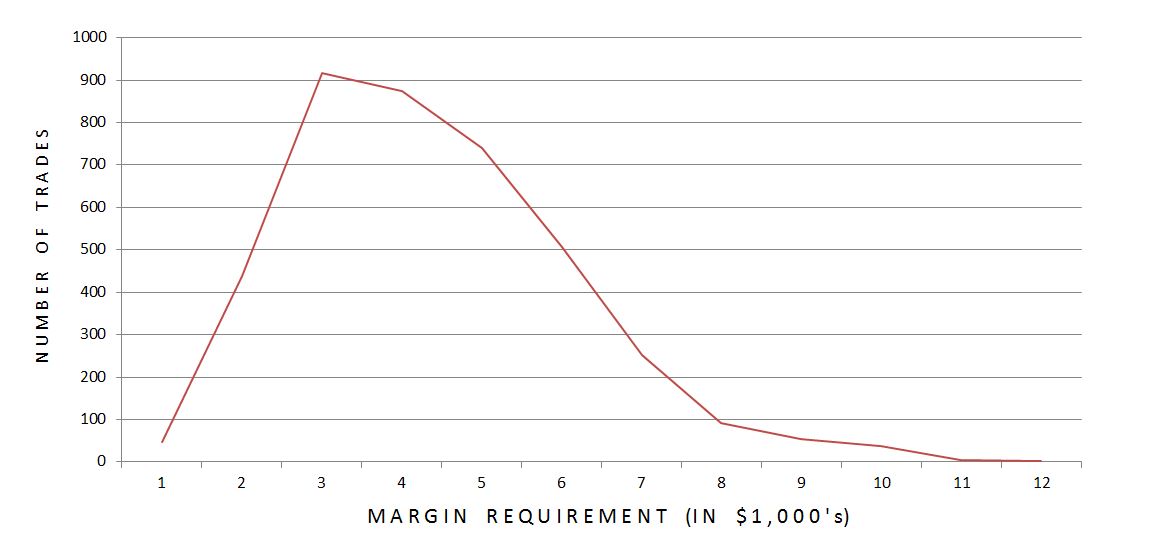
Indeed, 88.8% of trades had MR within the lower half of the range. While cheaper trades significantly outnumbered expensive ones, only 54.8% of trades had MR below the arithmetic mean. The impact of this skewed distribution is questionable.
Having a more significant impact would be trades where the long option(s) would have been left to expire worthless in live trading. These seemed to occur later in the data series at higher prices for the underlying. Being forced to allow one or two long options to expire worthless saves approximately $20 or $40 per trade, respectively.
I will continue the discussion in my next post.
Categories: Backtesting | Comments (1) | PermalinkDynamic Iron Butterflies (Part 1)
Posted by Mark on February 2, 2017 at 07:13 | Last modified: December 2, 2016 14:50I want to trade butterflies and the only way I can get myself to trade something new is to backtest it. This study is based on a Tasty Trade segment from April 1, 2016.
The subject of this analysis is dynamic iron butterflies (DIBF). Without further ado, let’s jump ahead to the results:
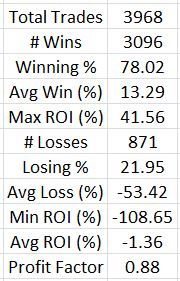
This is a completely different profile than that presented in the Tasty Trade video! Make no mistake: with an average loss posted after 3,900 trades, this is ugly.
These negative results were very surprising to me. I have been conditioned to be a believer in short strangles (the butterfly’s undefined-risk counterpart) and I have personally done some backtesting to support that belief.
Before throwing the proverbial baby out with the bathwater, let’s step back and critique the methodology.
My first thought is that I was probably heavy on the transaction fees. $26/contract might be reasonable during fast-moving markets but is probably excessive in most cases.
Second, instead of expiring DOTM longs in the later years of backtesting, I sold them for the nickel (or less) they were stated to be worth. In reality, I probably would not have been able to sell them so close to expiration and I would have been spared that $26/contract. Proceeding in this fashion saved time (it took me four months to do this study) and I am typically comfortable with backtesting bias that favors the losing side.
My third question mark surrounds asymmetrical loss, which may or may not be an issue. I calculated profit/loss in terms of ROI(%) because the margin for a 1-contract trade ranged from $1,401 to $12,400. With ROI(%) itself serving as normalization, I discovered the discrepancy. In some cases the market moved far against the trade to the downside causing > 100% loss (transaction fees). In other cases the market moved far to the upside causing a more limited loss (e.g. 50 – 90%). Some trades also ended up symmetrical: maybe these should be separated out?
The average loss was just over four times the average win, which completely nullifies the benefit of 78% winners. That suggests an MAE analysis to see if stops could be beneficial.
Categories: Backtesting | Comments (2) | Permalink