Naked Put Study 2 (Part 2)
Posted by Mark on November 4, 2016 at 07:05 | Last modified: August 24, 2016 09:02Last time I began to analyze a second comprehensive naked puts (NP) backtest. Let’s begin with a comparison to shares.
Here are the corresponding trade statistics for long shares:
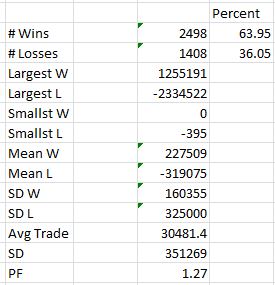
Comparing and contrasting this table to the one in Part 1 reveals many interesting observations.
First, the long shares trade is profitable ~64% of the time versus 90% for the NPs. The more I win, the easier it is psychologically to stick with a strategy.
Second, the largest loss is only 1.86x the largest win for the long shares rather than 11.6x for the NPs. The average-loss-to-average-win ratio is only 1.40 for the long shares rather than 5.77 for the NPs. Losses don’t occur often with the NPs but when they do they can really hurt.
Third, the ratio of standard deviation (SD) of losing trades to SD of winning trades is 2.03 for long shares and 18.2 for NPs. This would appear to be a bonus for the long shares trade except the SD of losing trades is similar for both. The winning trades demonstrate much higher variability in the long shares trade. This suggests the income is not as predictable for long shares as NPs, which is also consistent with the lower winning percentage.
Finally, the average trade is roughly double for long shares. Surprisingly, the profit factor is higher for NPs: 1.58 vs. 1.27. I find it difficult to rectify this difference except to say that the long shares made roughly $100M in this backtest vs. $61M for the NPs.
For the remainder of the post, I will talk only about NPs.
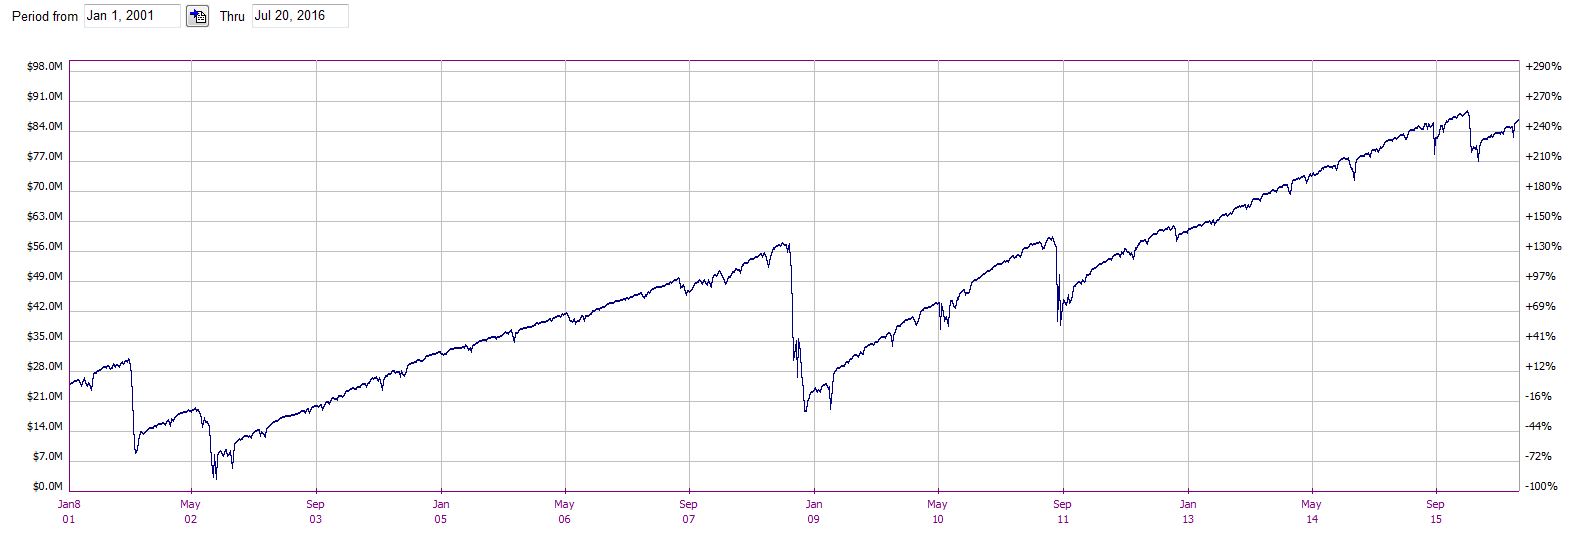
What do you see in the NP performance graph?
ICYMI, take a look at these trade statistics:
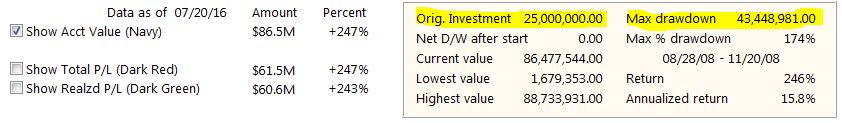
This NP trade has a problem! The maximum drawdown (DD) is greater than the starting equity. The account never went to zero because the max DD occurred roughly halfway through the backtest. Had the max DD occurred earlier, the account could have gone bust. I would not be happy had I started trading NPs in fall 2008.
This is something to keep in mind when thinking about position sizing. Also remember the oft-quoted adage “your worst drawdown is always ahead of you.” Starting this trade with $50M in the account rather than $25M would have avoided Ruin but the annualized return would be cut in half. To be safe, I like to double the max DD and contemplate that as a requirement for starting equity. In this case, the annualized return would be reduced to ~4.5%.
Comments (2)
[…] believe DD analysis should be applied to any trading strategy. Even without the second table of trade statistics, DD analysis could be done in a few easy steps. First, note the starting equity on the left edge of […]
[…] previously presented data comparing the naked put (NP) trade with long shares. This suggested outperformance […]