Implied Volatility Spikes
Posted by Mark on August 27, 2019 at 07:16 | Last modified: May 14, 2020 11:14One of my projects next year will be to clear out my drafts folder. Most of these entries are rough drafts or ideas for blog posts. This is one of 40+ drafts in the folder: a study on incidence of IV increase.
For equity trend-following (mean-reversion) traders, IV spike is a potential trigger to get short (long).
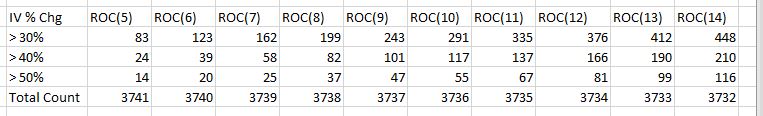
This was a spreadsheet study I did in December 2016. I looked at RUT IV from 1/2/2002 – 11/17/2016. I calculated the number of occurrences IV increased by 30% or more, 40% or more, and 50% or more over the previous 5 – 14 trading days.
Here are the raw data:
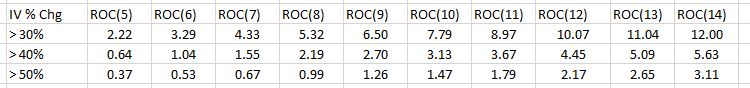
Here are the percentages:
If I’m going to test a trade trigger, then I would prefer to find one with a large sample size of occurrences. Vendors are notorious for the fallacy of the well-chosen example (second-to-last paragraph here). This is a chart perfectly suited for the strategy, system, or whatever else they are trying to sell. When professionally presented, it looks wondrous; little do we know it represents a small sample size and is something that has rarely come to pass.
This trigger may avoid the small sample size categorization. Even in the >50% line (first table), periods of 8 – 14 show at least 30 occurrences. Some people regard 30 or more as constituting a sufficiently large sample size. I think length of time interval is relevant, too. We have roughly 15 years of data here. 30 occurrences is about twice per year. If I want four or more occurrences per year, then perhaps I look to >40% (period at least eight) or >30% as a trigger.
With regard to percentages, my mind goes straight to the 95% level of significance. Any trigger that occurs <5% of the time represents a significant event. I still don’t want too few occurrences, though. 1.5 standard deviations encompasses 87% of the population so maybe something that occurs less than 13% of the time or ~6.5% of the time (one-tailed) could be targeted.
Another consideration would be to look at the temporal distribution of these triggers. Ideally, I would like to see a smooth distribution with triggers spread evenly over time (e.g. every X months). A lumpy distribution where triggers are clustered around a handful of dates may be more reflective of the dreaded small sample size.
The next step for this research would be to study what happens when these triggers occur. Once the dependent variable is selected, we have enough data here to examine the surrounding parameter space (see previous link).