Short Premium Research Dissection (Part 39)
Posted by Mark on July 5, 2019 at 07:03 | Last modified: January 11, 2019 08:33Continuing on with our author’s final analysis, she presents two “hypothetical portfolio growth” graphs for each of three delta stops: one with curves for 5% and 10% allocation and one with a curve for 25% allocation. Y-axis values and derived percentages are therefore relevant (see second-to-last paragraph here). None of these final graphs has a referent for the asterisk,* which we now know corresponds to the “hypothetical computer simulated performance” disclaimer shown here.
For each delta stop, she provides the usual table that falls short of the standard battery (second paragraph):
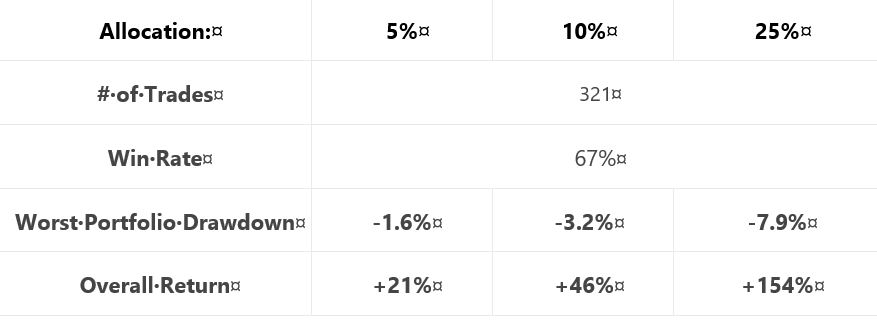
Similar to tables included previously (e.g. Part 15 and Part 20), a couple differences are noteworthy. First, she includes only the biggest rather than top 3 drawdowns (discussed in paragraph #2 below excerpt #1 here). This is characteristic of all tables in this final section (along with the lost 2007-2009 data, which was discussed in these final three paragraphs).
The other difference is inclusion of overall return rather than CAGR. As described in the paragraph below the first table here, things are sloppy when inconsistent from one sub-section to the next. This is the first time we are seeing “overall return.” Also as discussed in that same paragraph, the critical analyst should ask “why” when something changes without explanation. It’s no big deal here either, though. While overall return impresses more (larger in magnitude), CAGR works fine.
I have been calculating CAGR/MDD throughout this mini-series (e.g. Parts 33, 25, 22, 21, 20, 15). To convert from overall return, I’d have to approximate the backtesting interval (she never gives us the exact dates). I could then calculate CAGR/MDD, although it would not be comparable to previous sections due to the unexplained lost data.
Another source of significant sloppiness is passive disappearance of the VIX filter. The VIX filter was used in generating the final graph of the previous section (shown here). Like the lost data, the VIX filter has been absent in these “most up-to-date trading rules.” If the filter only comes into play for the 2008 crash, then it may represent curve fitting. Some explanation should be given for its sudden omission to preserve our author’s credibility.
With regard to sizing this strategy per individual risk tolerance, she unfortunately does not backtest an expanded parameter range (Part 38, paragraph #2) to help us truly understand allocation limits.
In the final sub-section, she presents a recent trade that probably serves a marketing purpose more than anything else. It’s always nice to hit the profit target after only five days. Beginning November 2, 2018, it probably was not included in the historical backtesting, which is fine (less fine is the omission of backtesting dates). I think something current stokes confidence more than something stale. I often wonder how many people click to order reports, trading systems, trader education products, etc., from websites with content a few years old at best. The graphs always look good. Only when you look close and dig deeper are you well-poised to identify errors and expose the fiction.
I will begin to wrap things up next time.
* The rare +1 she scored in Part 38 paragraph #4 is effectively offset.