Short Premium Research Dissection (Part 29)
Posted by Mark on May 30, 2019 at 07:40 | Last modified: December 25, 2018 08:14Picking up where we left off, our author writes:
> The previous study tested rolling up the… long put options when
> a 25% profit target was reached. What about rolling up the long
> puts when the stock price rises to a price equal to or greater
> than the long call’s strike price?
Her stated methodology has two differences from the Part 27 study:
- Rolling is only done to 16-delta put
- “Stock price > long call strike” added as second adjustment trigger
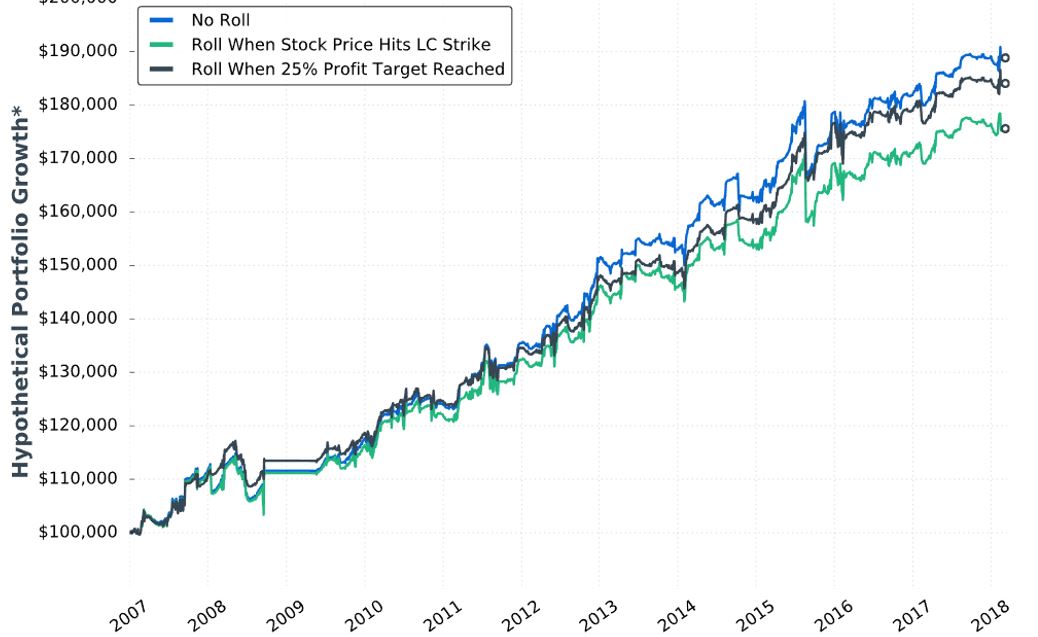
She gives us hypothetical portfolio growth graph #12:
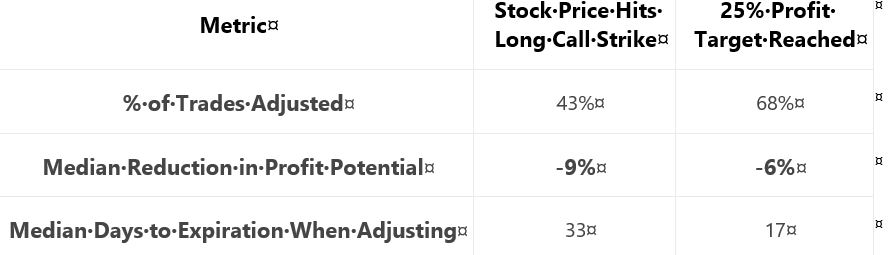
She gives us these statistics:
She writes:
> …results can be explained by the fact that… adjustment
> was usually made earlier when adjusting if the stock price
> exceeded… long call strike… With more time until
> expiration, the put-rolling adjustment was more expensive…
> when adjusting at… 25% profit… there was usually less
> time until expiration, which resulted in a cheaper roll.
My criticism of this sub-section will probably sound familiar by now.
The graph is inconclusive: No Roll finishes on top with little difference [throughout the backtesting interval] between curves, lack of inferential statistics to diagnose real differences, and likelihood of any apparent differences being due to 1-2 trades.
Once again, she offers a table with sporadic statistics never before seen.* She does not present the standard battery. I cannot even determine how many trades were adjusted because she does not tell us the sample size and/or distribution (temporally or by PnL) of trades.
As discussed in the paragraph below second excerpt here, I think caution should be applied when explaining results. I have gotten the impression throughout that her studies employ a relatively small sample size. Assuming that to be the case, it would only take a couple trades in the opposite direction to get a reorganization of top performers. This would suddenly make any good explanation look quite foolish. Besides, all her effort may be to explain differences that wouldn’t even classify as real were the [omitted] inferential statistics to fail in rejecting the null hypothesis.
Put another way, why results are what they are really doesn’t matter. We tend to feel better when we have reasons because human nature is to seek out causal relationships even when none may exist. The financial media thrives on this daily (separate topic for a dedicated post).
I will continue next time.
* I like % trades adjusted” and “median DTE when adjusting,” but [doing best Leonard McCoy
impression] for G-d’s sake man either present them consistently for global comparison or
don’t present them at all.