Short Premium Research Dissection (Part 27)
Posted by Mark on May 24, 2019 at 07:12 | Last modified: December 24, 2018 10:09I can now continue with our author’s next topic: rolling up the long put (limited-risk strategy).
In effect, this is closing the PCS mentioned here to reduce asymmetrical downside risk. Her goal is to do it for a lower cost. To this end, she discusses rolling after options have decayed and the trade is up 25%.
Like Part 21, she gives us a fuller study methodology. She does not give us exact backtesting dates, number of trades, or [inferential] statistical analysis, however, which limits our ability to discern significant differences.
Here is hypothetical performance graph #11:
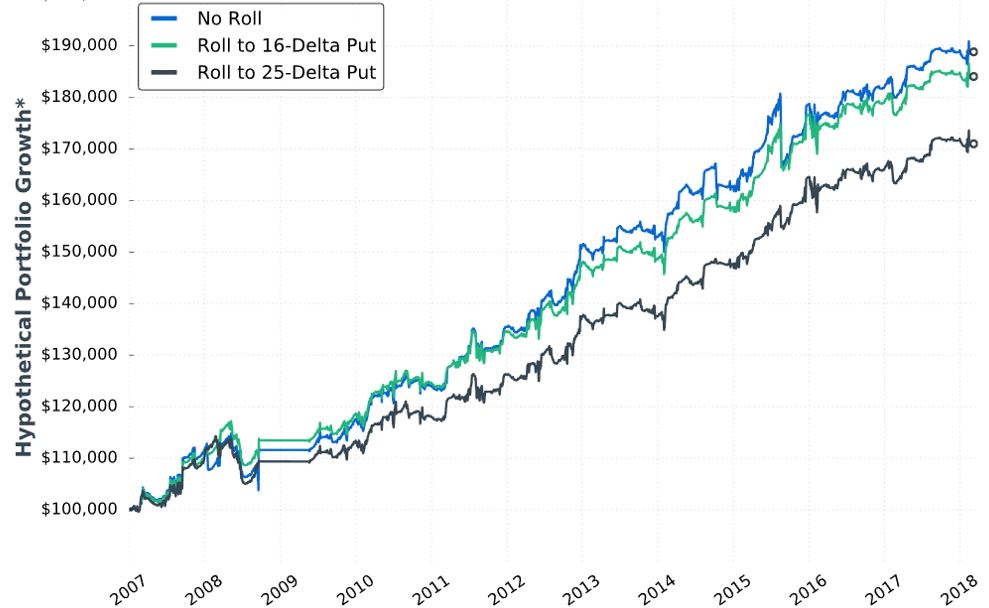
She writes:
> …rolling up the put options resulted in less overall
> profitability compared to not rolling at all. It makes
> sense, as we have to pay to roll up the long put option,
> which decreases the maximum profit potential on the trade.
She then gives us:
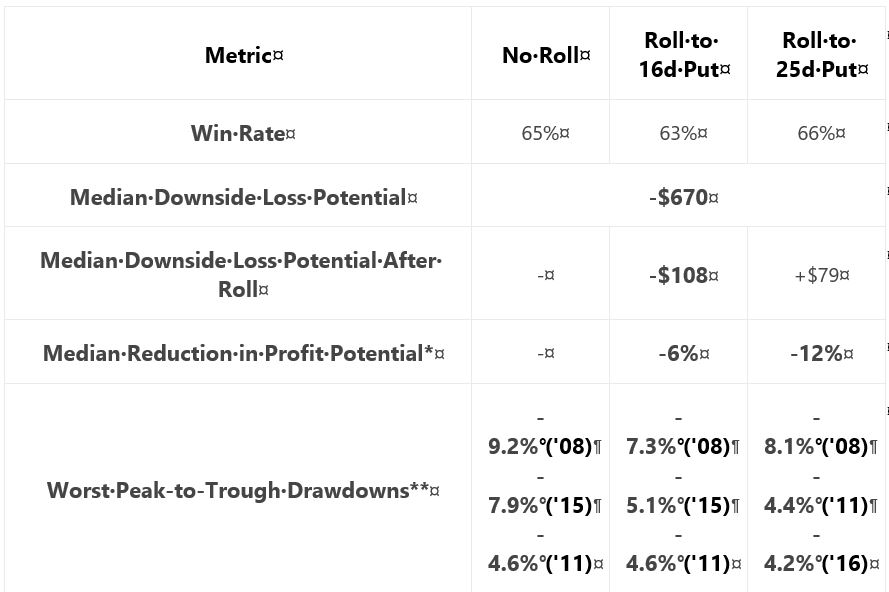
She claims “the adjustment reduced the worst portfolio drawdowns (DD) by notable margins.”
Unfortunately, I’m not sure how notable this is. I would expect DDs to follow the order of No Roll > 16-delta > 25-delta. Seven of nine comparisons (e.g. for three different years, comparing No Roll to 16- and 25-delta along with 16- to 25-delta) follow this order. Why is there no 2011 difference between 16- and 25-delta? Why is DD greater for 25- than 16-delta in 2008? Furthermore, I think DD differences are likely due to 1-2 trades. Recall my repeated concern with curve fitting (last mentioned below the excerpt here). I want to base strategy on what happens with a large sample size of trades.
Aside from omitting inferential statistics, lack of the standard battery (see second paragraph of Part 19) muddles “notable.” We can see from the graph that rolling hurts profitability [a little], the table states rolling decreases DD, but she fails to present CAGR to calculate CAGR/MDD (see third-to-last paragraph here). If DD differences are due to 1-2 trades, then I would like to compare more inclusive statistics like average win/loss, average DIT (should be longer due to adjustment cost), and standard deviation (see third paragraph here).
Another useful comparison might be between just those trades where the roll gets triggered. The roll doesn’t always get done and including identical trades in both groups may mask adjustment differences.
I am happy to see her backtest a rolling adjustment, but this specific choice concerns me. Rolling later in the trade and/or when the market has gone the other way is protecting against a short-term move and/or a large whipsaw—both of which are rare circumstances. I think of it like this:
- In only a limited number of cases does the market fall enough to cause this trade to lose.
- If the market rallies, then the market must fall more in order to cause this trade to lose; this represents a limited number of limited cases.
- If the market trades sideways (or even slightly down) for long enough to trigger the roll, then the market has less time to fall enough to cause this trade to lose; this represents a limited number of limited cases.
I worry this adjustment is like the Band Aid discussed in third paragraph below the graph here: a sign of curve fitting.
I will continue next time.