When Performance is Irrelevant (Part 3)
Posted by Mark on April 24, 2017 at 07:32 | Last modified: November 22, 2016 09:48In this blog mini-series I’m considering the possibility that financial performance reporting is at least misleading and at most irrelevant. As a third example, today I will discuss a prospectus for the T. Rowe Price Value fund.
First, take a look at the following table:
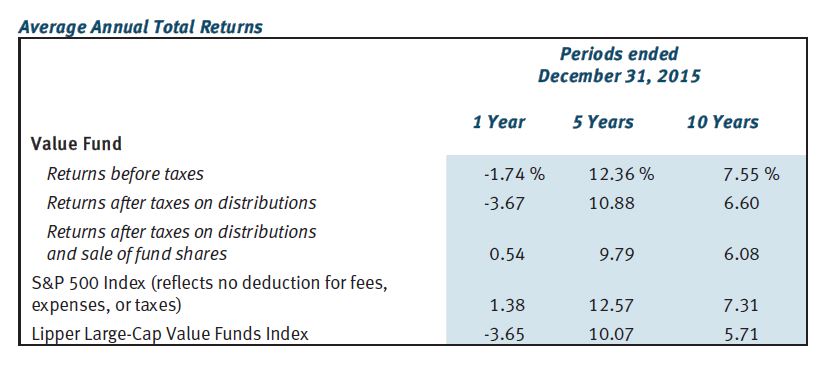
This gives us something against which to compare the fund’s performance. The Value Fund outpaced S&P 500 over 10 years but fell short over one and five. Value Fund beat the benchmark (Lipper Large-Cap Value Funds Index) over all three time frames but operating expenses (0.81%) are not included. Your actual performance would therefore fall short of the numbers reported here.
Once again, why be deceptive? Why not provide a historically accurate report of how the fund performed?
The prospectus also includes the following graph:
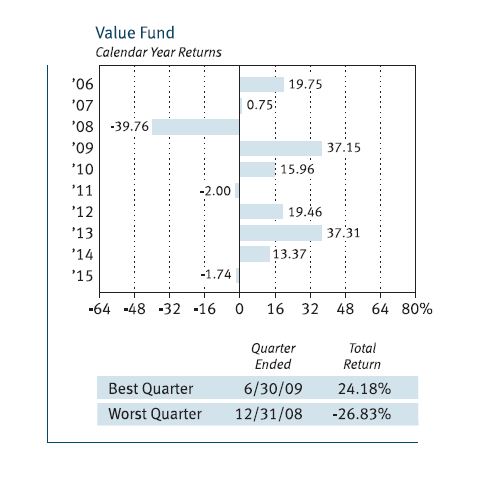
This gives us a 10-year track record to look at, which is better than the two years seen with American Funds Growth Portfolio. Ten is still a small sample size, though.
What may be worse is that each of the 10 samples is itself far too small a sample. I mentioned this with regard to the Vanguard prospectus: we do not see any error bars on the graph.
What happens in any particular calendar year is only one representation of an infinite number of potential occurrences. What if a large bankruptcy had been announced December 29 instead of January 5? What if Friday fell on the 31st instead of the 1st causing a jobs report to be delayed a week? What if a verbal misunderstanding, a dropped call, or a random muscle twitch had resulted in two countries going to war?
The fact that altered events can theoretically result in significant performance differences suggests just how trivial any single sample is. For me this is strong motivation for Monte Carlo simulation.
Monte Carlo simulation is a methodology used to generate large sample sizes. Given a system with many trades, toss the profit/loss numbers into a hat, mix thoroughly, and pick randomly to get different trade sequences. This can be done thousands of times. Robust descriptive statistics may then be used to generate and discuss probability-based future predictions of performance.
Monte Carlo simulation is unfortunately the exception—not the rule. Singular performance numbers based only on specific historical records are routinely reported. Laypeople in droves (along with their investment advisers) make frequent decisions based on these reports that, I would argue, are statistically meaningless.
This is a big reason why I suspect financial performance may be irrelevant.
Categories: Financial Literacy | Comments (0) | Permalink