When Performance is Irrelevant (Part 2)
Posted by Mark on April 21, 2017 at 06:19 | Last modified: November 18, 2016 10:26In this blog mini-series I’m considering the possibility that financial performance reporting is at least misleading and at most irrelevant.
Last time I briefly discussed a prospectus for a Vanguard fund. As a second example, let’s look at the American Funds Growth Portfolio prospectus:
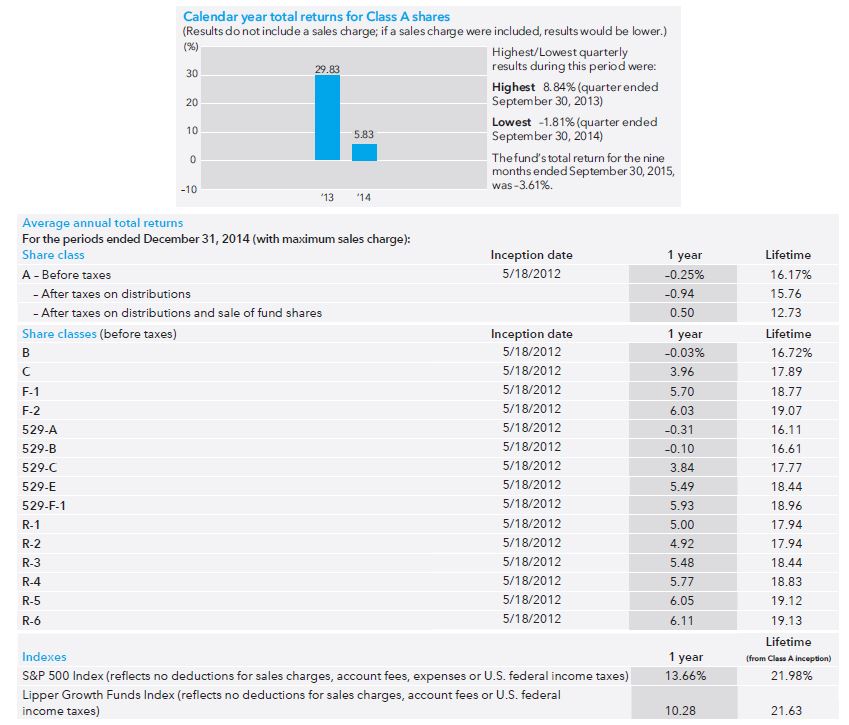
The first thing I noticed here is the short track record. The bar graph only shows performance for two years since the fund opened May 2012. Instead of 10 tiny samples (Vanguard), here we have two tiny samples.
An additional problem is a failure to include the sales charge. The disclaimer “if a sales charge were included, results would be lower” is nice but they don’t tell us how much lower it might be. I would like to see the maximum possible sales charge included as they did in the table. If the worst-case performance is acceptable then I’m more likely to invest. Either way, the point of a graph is to show and they failed to do that because what they graphed is not realistic.
The table indicates that every share class (of which there are many) underperformed the S&P 500 and the benchmark (Lipper Growth Funds Index). This is not encouraging but again, the sample size is sufficiently small here to mean very little. For a quick second I am happy that they at least included the sales charge.
But don’t think for more than a second that they reported the actual performance because other fees are not included. Evidently it does not pay to look only at the performance section because earlier in the prospectus we see:
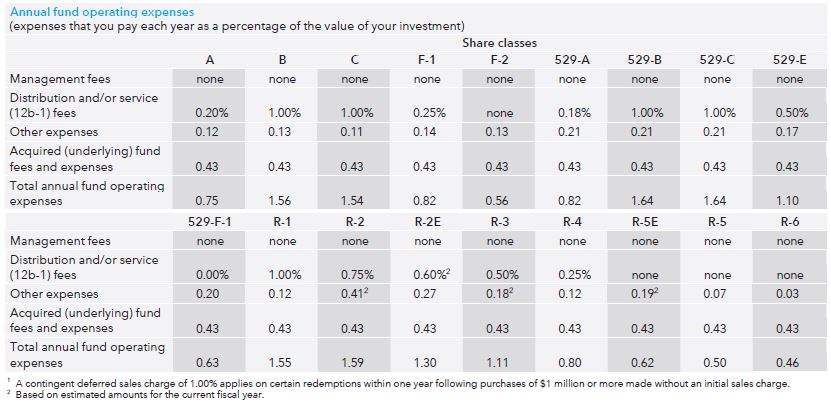
“Operating expenses” range from 0.46% – 1.64% annually. I called to get more information and only Class A and Class C shares are available to me as a prospective retail investor (“individual nonqualified account”). That means I would be stuck with a 0.75% annual fee on top of a 5.75% load (sales charge) and 1% redemption charge or a 1.54% annual fee with no load and a 1% redemption charge. Unfortunately neither annual fee nor redemption charge is included in the graphs or the tables, which means the reported performance numbers are optimistic exaggeration.
Is this deceptive advertising?
I will continue next time with one final example.
Categories: Financial Literacy | Comments (1) | Permalink