Naked Put Study 2 (Part 8)
Posted by Mark on January 5, 2017 at 06:46 | Last modified: October 19, 2016 12:04I left off analyzing stop-loss data for naked put study 2.
In particular, I noted the importance of the net-return-to-max-drawdown (DD) ratio. In looking at the 2x vs. 5x stop levels, for example, the difference in net return is not that big at 27%. The difference in DDs is big and combining the two as ratios reveals a 2.11-fold difference.
By proportionally changing position size to normalize DDs, we can better see DD impact as risk-adjusted return:
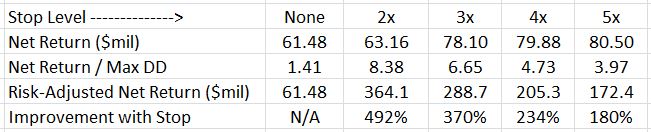
The last column sums it up. Even the loosest stop (5x) led to a 180% performance improvement. The tightest stop led to improvement far better than that.
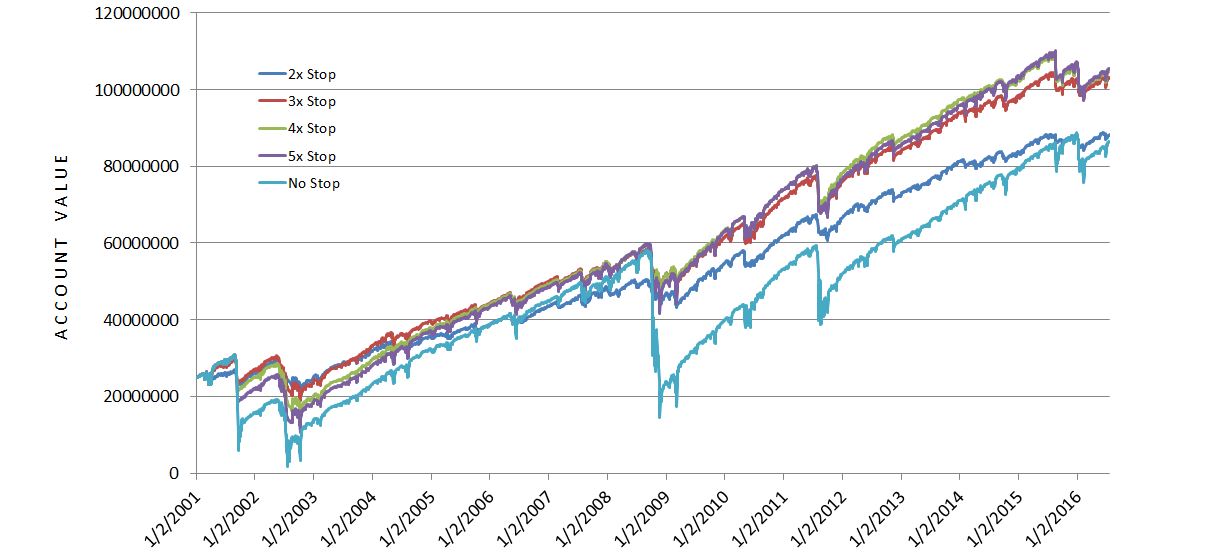
Graphically, backtested performance looks like this:
Here is the same graph normalized for maximum DD (risk-adjusted):
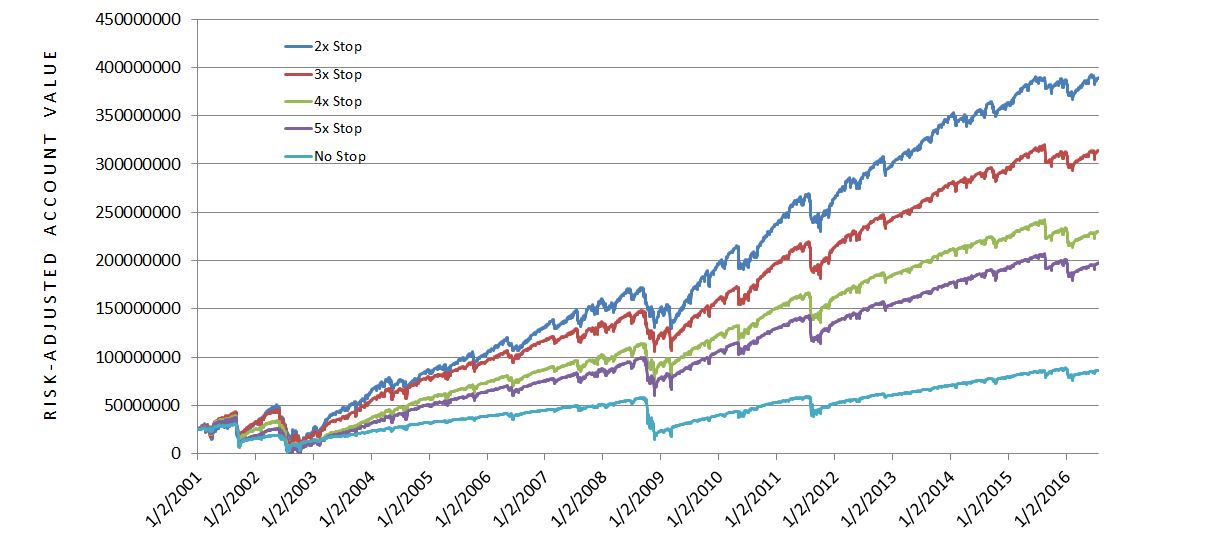
The worst DD occurred during the 2008 financial crisis. If you look closely at that part of the graph then you will see comparable losses.
Outperformance can result from trading a system with greater net returns. Outperformance can also be achieved by selecting a system with lower DDs. Lower DDs allow for larger position sizing, which also leads to greater net returns.
Just out of curiosity, I ran some numbers to see if max DD was proportional to stop levels. In other words, did the max DD at 3x exceed that at 2x by 50%? Was the max DD at 4x 20% less than the max DD at 5x? Six comparisons were done: 2x vs. 3x, 2x vs. 4x, 2x vs. 5x, 3x vs. 4x, 3x vs. 5x, and 4x vs. 5x. The 5x max DD was just barely less than 25% more than the 4x max DD. In the other five cases, though, the max DD was more than proportionally greater for the higher stop level.
I really have no meaningful conclusions to draw from these comparisons. I thought it might be a bonus benefit if the higher stop levels were accompanied by less-than-directly-proportional max DDs but this was not the case. These comparisons were based on one data point (max DD). What might be more useful would be to look at average loss (mark-to-sale multiple) for each stop level. This would represent a larger sample size.
Along these lines of small sample size, I also regard the equity curve comparison to be limited. While the graph looks impressive as summary data of a 15-year backtest, it is only one possible equity curve generated by this system. At the least, in other words, these equity curves represent a single ordering of trades. In the future I would be interested in doing a Monte Carlo simulation to study the distribution of net return and max DD values. Whether to do the simulation with or without replacement of daily equity changes is something for further consideration.
Categories: Backtesting | Comments (0) | Permalink