Naked Put Study 2 (Part 9)
Posted by Mark on January 10, 2017 at 07:24 | Last modified: October 21, 2016 12:56Today I will tie up a couple loose ends regarding NP Study 2.
First I present overall trade statistics stratified by stop level:
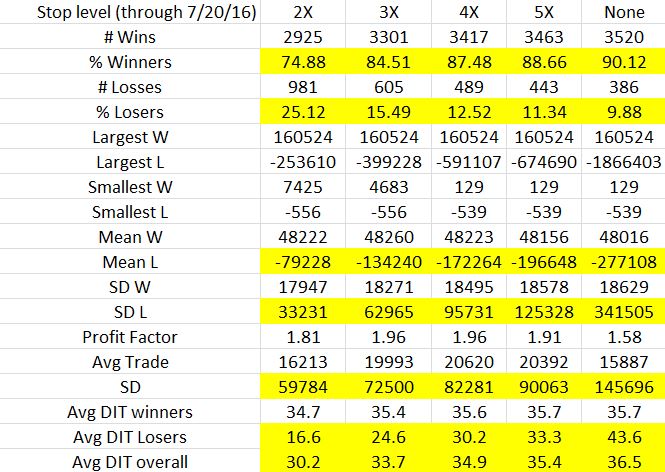
Cells that show trends from low (tight) to high (loose) stop level are highlighted:
- The looser (tighter) the stop, the higher the winning (losing) percentage
- The looser the stop, the higher the average loss and standard deviation of losses (more extreme outliers)
- The looser the stop, the higher the overall standard deviation of trades (more extreme outliers)
- The looser the stop, the longer the average losing trade and overall trade (stops shorten what would otherwise be trades taken to expiration)
Average trade and profit factor both peak at the 4X stop level. I find this interesting because net return / maximum drawdown (MDD) peaks at the 2X stop level. To me, that was a pretty compelling case to use 2X.
Which statistics are more meaningful in this comparison brings us to the second loose end: my previous mention about Monte Carlo simulation. The trade statistics shown in the table above are based on 3,906 trades. The MDD is based on just one possible selection of trades. If I stick with the percentages and run multiple simulations with replacement then I can take averages of the MDD and other portfolio parameters. I think this would be very insightful.
I go back and forth as to whether the Monte Carlo simulation should be done with or without replacement. To give me the most confidence in trading the system, I want to select the method that is more likely to underestimate returns. In thinking back over the last 15+ years, we have seen some unlikely (multiple standard deviations) market crashes. Simulating with replacement could result in a higher or lower number of extreme losses. Simulating without replacement will result in the same number of losses in random order. This means the MDD will vary depending on the extent to which losing trades become grouped together.
I doubt any blanket answer to this question exists. I should probably do 10,000 simulations each way and see how they compare.
Time to brush up on MS Excel…
Categories: Backtesting | Comments (0) | Permalink