Stop at the Equity Curve (20) (Part 3)
Posted by Mark on July 14, 2016 at 06:20 | Last modified: May 16, 2016 15:55The end-of-trade PnL equity curve filter looked promising but mark-to-market (MTM) is what I would encounter in real-time.
To do this, I replicated a previous backtest from 5/1/2008 through 3/16/2009 and tracked daily account value. The 239 days between 6/17/2008 and 2/4/2009 was the shortest elapsed time to get four exit signals.
I expected the MTM equity curve to largely parallel the equity curve generated previously. I expected some evidence of future shift since the end-of-trade PnL (spreadsheet) approach counts the final trade PnL on the date of trade inception:
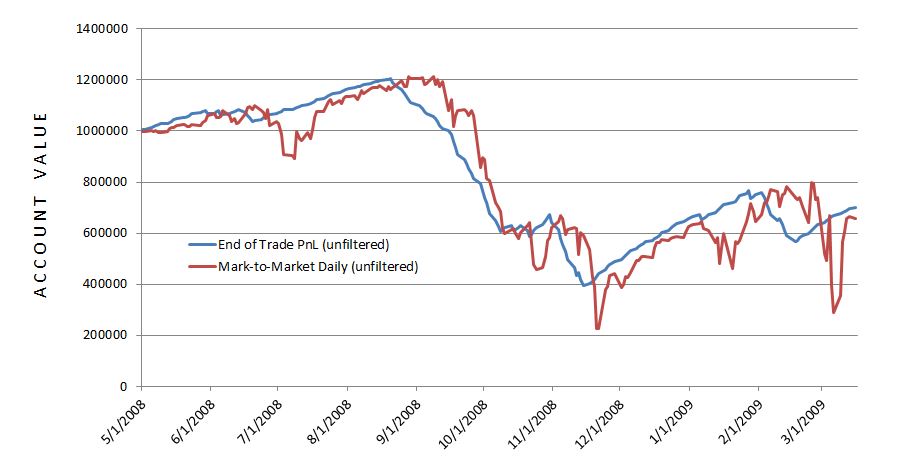
The future shift is evident along with much more volatility in the MTM daily curve. With regard to filter efficacy:
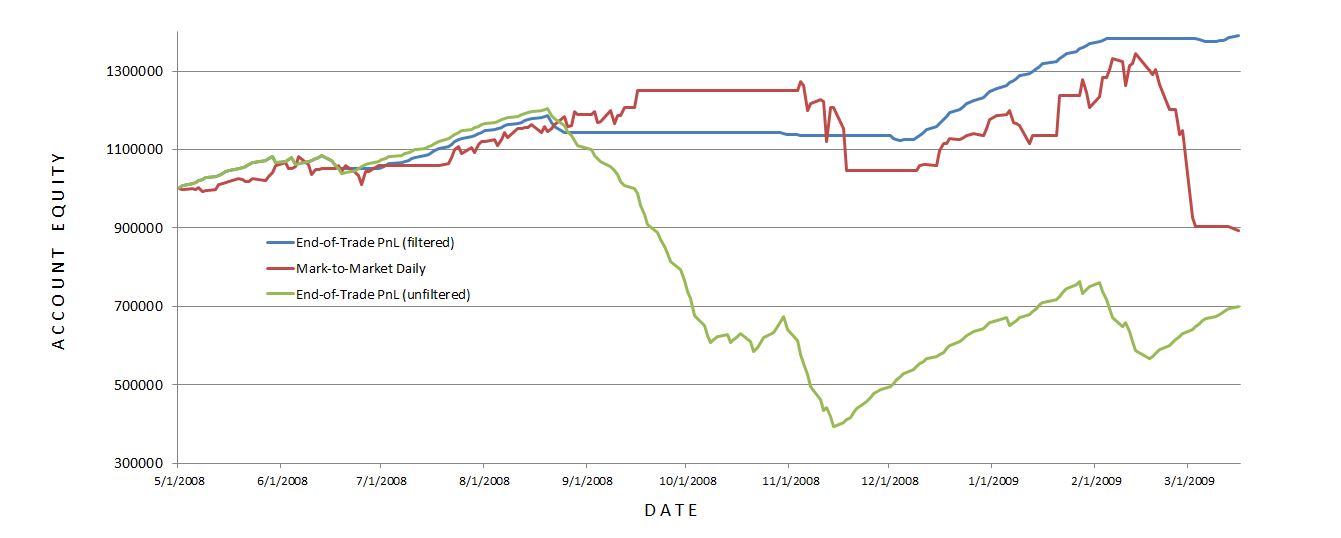
I was disappointed with MTM daily’s performance with the 20-SMA trade filter. It worked well until Feb 2009 when it suffered a very large drawdown (DD). This was the maximum DD seen with the MTM daily equity filter and a larger DD than seen without! This suggests winning (losing) days were (not) filtered out: a dangerous combination.
A closer look at the data shows the MTM daily equity filter was more active than the end-of-trade PnL filter. The former (latter) generated 13 (4) signals. Of the 13 signals, five or two lasted one or two days, respectively. This suggests a large number of whipsaws because such a filter will be effective by signalling a big market decline to remain on the sidelines for an extended period. The MTM filter was particularly ineffective in March 2009 as the strategy in the market on March 2 to lose $220K and out of the market on March 4 to miss a $175K gain.
The graph shows the MTM equity curve filter did about $200K better than no filter at all. However, with all the whipsaws I am not convinced it is any more effective. I would need a longer MTM backtest to be convinced.
Backtesting made it clear why the MTM daily filter was so much more volatile. The end-of-trade PnL method only gains or loses the value of one trade per day. Although this is big money for the largest losers, on big down days the MTM daily filter method loses big money on all of the open trades.
While the end-of-trade PnL filter was quite effective, as I suspected it is very artificial and looks nothing like the MTM daily filtered equity. If I want to continue studying an equity curve approach then I should backtest over a longer period. Alternatively, I could look to price action of the underlying for DD minimization.