Stop at the Equity Curve (20) (Part 2)
Posted by Mark on July 11, 2016 at 07:27 | Last modified: May 13, 2016 17:21Consider this a manuscript in reverse. Having detailed the problems and limitations last time, today I will present the eye-popping, artificial results.
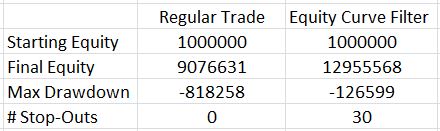
Here are the total return and drawdown numbers:
Here are the overall system statistics:
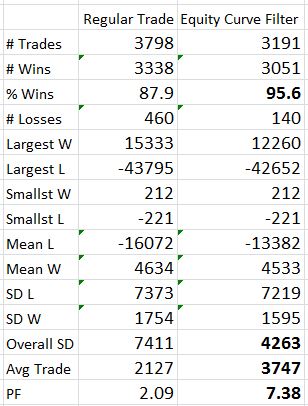
The filter clearly did a good job of removing losing trades. I highlighted the numbers that really tell the difference. The filter removed 607 trades but the % wins increased from 88% to over 95%, the overall standard deviation was reduced by 42%, and the average trade was 76% higher!
The Profit Factor went from solid to a ridiculous 7.38. This number is high enough to be worrisome. Aside from the caveats I mentioned last time, no slippage was factored into the stops so I know performance would not be this good.
The next step is to backtest several months and mark-to-market daily. I can even make sure to input the same trades as used last time. I want to see how the shape of the equity curve compares and see if significant differences exist between drawdowns.
If that ends up similar then the next step will be to study long puts. With the MA undercut 30 times, I have many instances to study in order to see how a delta-neutral position fares.
Once that’s done, I need to investigate the parameter space for MA period.
Comments (1)
[…] end-of-trade PnL equity curve filter looked promising but mark-to-market (MTM) is what I would encounter in […]