Where Do I Start?
Posted by Mark on July 19, 2016 at 05:16 | Last modified: May 25, 2016 10:30The following question was posted in an investment group I follow:
> I was hoping someone might be kind enough to meet with
> me for dinner or drinks and show me the basics. I’m
> looking to get started investing but I have no idea where
> to start so it would be really great to get some advice.
Anyone who knows me would not be surprised to see me jump at the opportunity to talk about investing WHILE BEING TREATED TO DINNER AND DRINKS. Are you kidding me? I could talk about this stuff all day long for free and enjoy it. Dinner and drinks is just “icing” (figuratively, of course, since dessert does not seem to be included).
But then I got to thinking: what exactly is she asking for and does the question even make sense?
I know one thing: regardless of the teaching, any pupil may or may not make money in the markets. This theme runs extensively through my writings. In a recent post, for example, I quoted Garrett Baldwin who basically said consistent and accurate forecasting of future prices does not exist. For the same reason, nobody can guarantee profits.
This leads me to believe that education may be the only guarantee anyone can make in this space. I can teach her about stocks and investment vehicles: what they are, what it means to trade them, and how to trade them. I can teach her how to do the math to determine whether she is profitable. None of this guarantees she will make money, though: a singular fact that should be part of any introductory education.
For this reason, clarifying her question might be helpful. If she is looking for hints about my Holy Grail trading system or hoping to get me to spill my secret altogether over one too many beers then she will be disappointed. I think many people believe the Holy Grail does exist and finding it is just a matter of getting the proper education. If only it were that easy…
This is certainly not to say that education has no value. Some people search endlessly for the Holy Grail. They attend a plethora of investment seminars, buy “education” packages, and subscribe to black box trading systems. These are the people who never got the memo about the nonexistent Holy Grail and for them, this one lesson alone could have saved countless sums of time and money.
Categories: Financial Literacy | Comments (0) | PermalinkStop at the Equity Curve (20) (Part 3)
Posted by Mark on July 14, 2016 at 06:20 | Last modified: May 16, 2016 15:55The end-of-trade PnL equity curve filter looked promising but mark-to-market (MTM) is what I would encounter in real-time.
To do this, I replicated a previous backtest from 5/1/2008 through 3/16/2009 and tracked daily account value. The 239 days between 6/17/2008 and 2/4/2009 was the shortest elapsed time to get four exit signals.
I expected the MTM equity curve to largely parallel the equity curve generated previously. I expected some evidence of future shift since the end-of-trade PnL (spreadsheet) approach counts the final trade PnL on the date of trade inception:
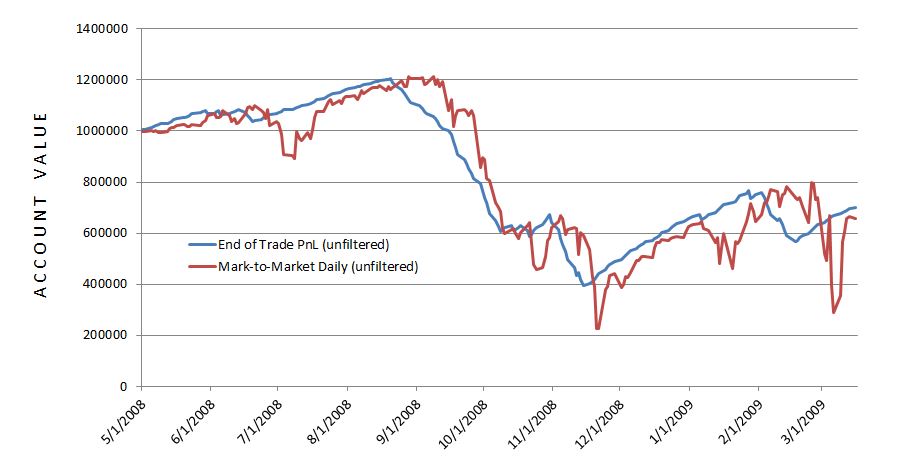
The future shift is evident along with much more volatility in the MTM daily curve. With regard to filter efficacy:
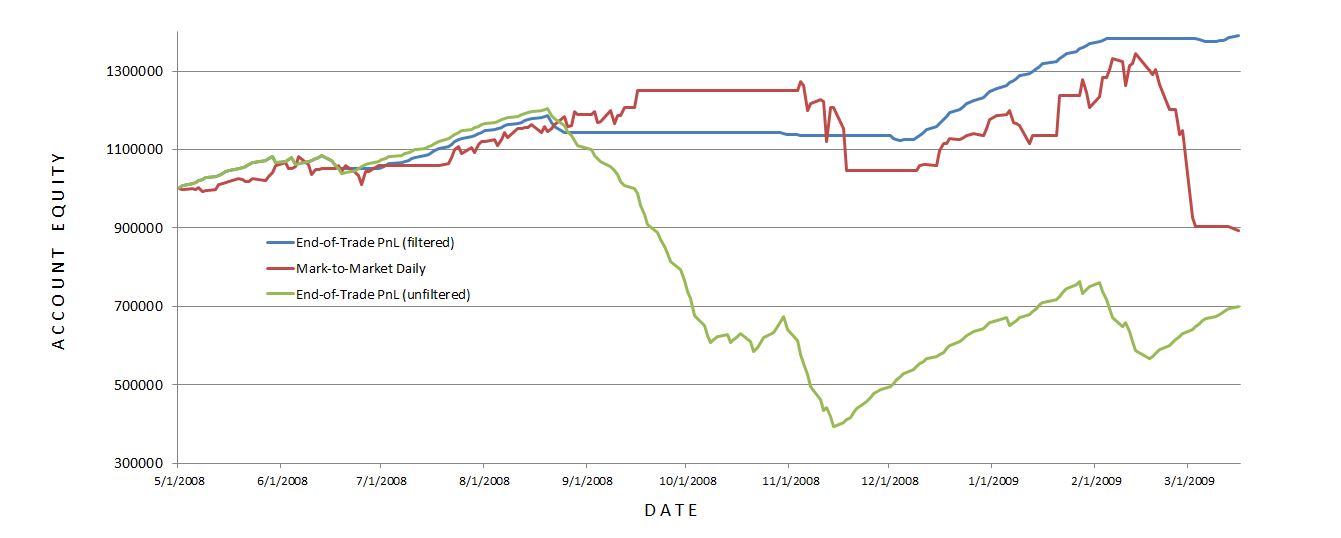
I was disappointed with MTM daily’s performance with the 20-SMA trade filter. It worked well until Feb 2009 when it suffered a very large drawdown (DD). This was the maximum DD seen with the MTM daily equity filter and a larger DD than seen without! This suggests winning (losing) days were (not) filtered out: a dangerous combination.
A closer look at the data shows the MTM daily equity filter was more active than the end-of-trade PnL filter. The former (latter) generated 13 (4) signals. Of the 13 signals, five or two lasted one or two days, respectively. This suggests a large number of whipsaws because such a filter will be effective by signalling a big market decline to remain on the sidelines for an extended period. The MTM filter was particularly ineffective in March 2009 as the strategy in the market on March 2 to lose $220K and out of the market on March 4 to miss a $175K gain.
The graph shows the MTM equity curve filter did about $200K better than no filter at all. However, with all the whipsaws I am not convinced it is any more effective. I would need a longer MTM backtest to be convinced.
Backtesting made it clear why the MTM daily filter was so much more volatile. The end-of-trade PnL method only gains or loses the value of one trade per day. Although this is big money for the largest losers, on big down days the MTM daily filter method loses big money on all of the open trades.
While the end-of-trade PnL filter was quite effective, as I suspected it is very artificial and looks nothing like the MTM daily filtered equity. If I want to continue studying an equity curve approach then I should backtest over a longer period. Alternatively, I could look to price action of the underlying for DD minimization.
Categories: Backtesting | Comments (0) | PermalinkStop at the Equity Curve (20) (Part 2)
Posted by Mark on July 11, 2016 at 07:27 | Last modified: May 13, 2016 17:21Consider this a manuscript in reverse. Having detailed the problems and limitations last time, today I will present the eye-popping, artificial results.
Here are the total return and drawdown numbers:
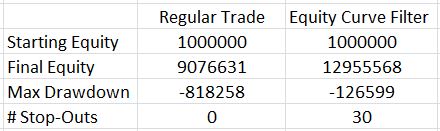
Here are the overall system statistics:
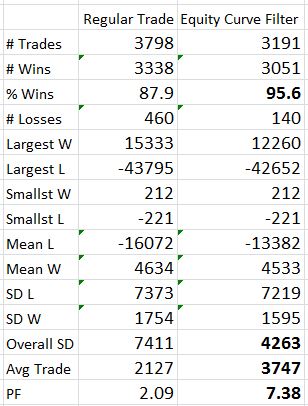
The filter clearly did a good job of removing losing trades. I highlighted the numbers that really tell the difference. The filter removed 607 trades but the % wins increased from 88% to over 95%, the overall standard deviation was reduced by 42%, and the average trade was 76% higher!
The Profit Factor went from solid to a ridiculous 7.38. This number is high enough to be worrisome. Aside from the caveats I mentioned last time, no slippage was factored into the stops so I know performance would not be this good.
The next step is to backtest several months and mark-to-market daily. I can even make sure to input the same trades as used last time. I want to see how the shape of the equity curve compares and see if significant differences exist between drawdowns.
If that ends up similar then the next step will be to study long puts. With the MA undercut 30 times, I have many instances to study in order to see how a delta-neutral position fares.
Once that’s done, I need to investigate the parameter space for MA period.
Categories: Backtesting | Comments (1) | PermalinkStop at the Equity Curve (20) (Part 1)
Posted by Mark on July 7, 2016 at 06:26 | Last modified: May 13, 2016 17:10What happens when the equity curve is used as an indicator to be in or out?
To study this, I used my -0.10/3x spreadsheet with 3,798 trades. As an arbitrary starting point, I used a 20-SMA (current day included) to be calculated after the close. When necessary, I waited one whole trading day to take action.
What’s particular about this approach is the methodology by which I have simplified the equity calculations but logistics must be considered when transitioning to real-time application. The final gain/loss registered at trade close is added to the account at trade inception. This creates the appearance of more continuity in the spreadsheet than might actually be experienced.
Consider a big down day that pushes multiple trades to maximum loss. The spreadsheet shows the total equity and MA after each trade is tabulated but in reality they would all be closed at once. This could significantly reduce the efficacy of the risk-management tool. From a mark-to-market perspective, it is conceivable that cumulative losses on many trades might drive equity below its moving average before any single trade actually closes for max loss. I’m afraid the only way to compare the two would be to backtest again and track daily equity in this manner. Hopefully it will become clear after a small sample.
When I traded naked strangles, I anecdotally noted great potential savings were I to have exited positions after incurring the greatest daily loss over the last several weeks and staying out of the market entirely until I saw a weekly equity gain. This makes me think there might be something useful about monitoring EOD equity vs. the moving average but I also wonder if this might be accompanied by more whipsaws.
Aside from timing issues, another issue requiring careful consideration is the position neutralization itself. Slippage would be horrific if I tried to close an inventory of legs especially if I had to replace them a few days later. I might be better off creating a delta-neutral position by purchasing NTM options and holding until the equity curve crosses above once again.
Having said all this, I’ll run through the results in my next post.
Categories: Backtesting | Comments (1) | Permalink