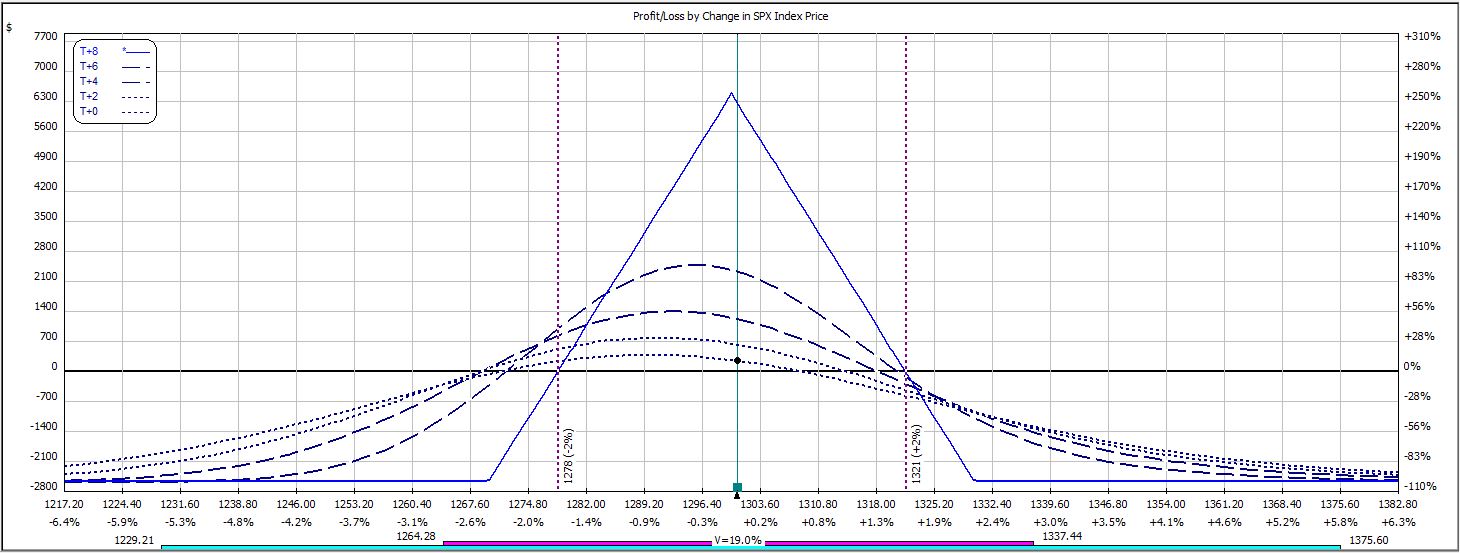
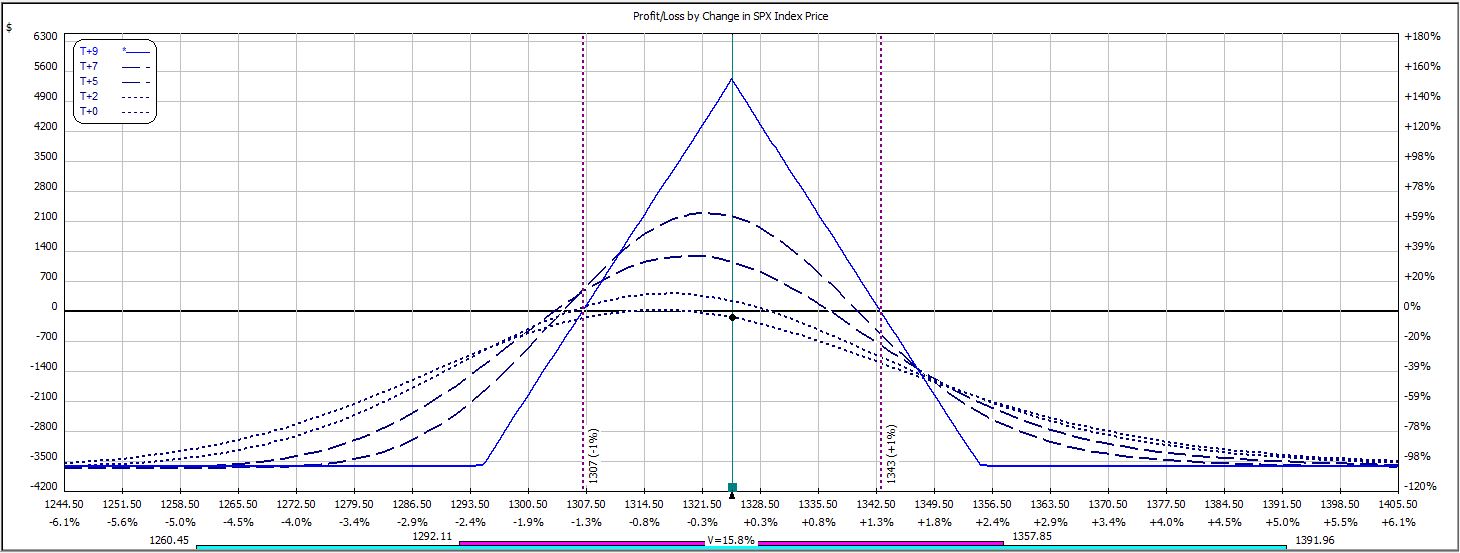
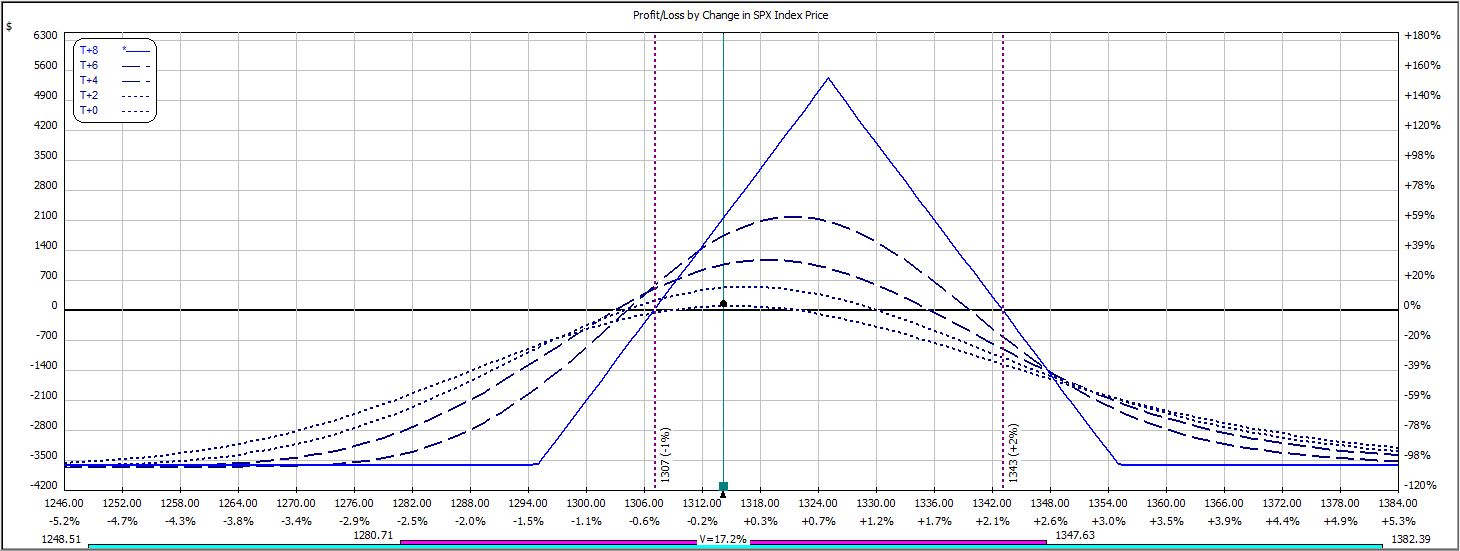
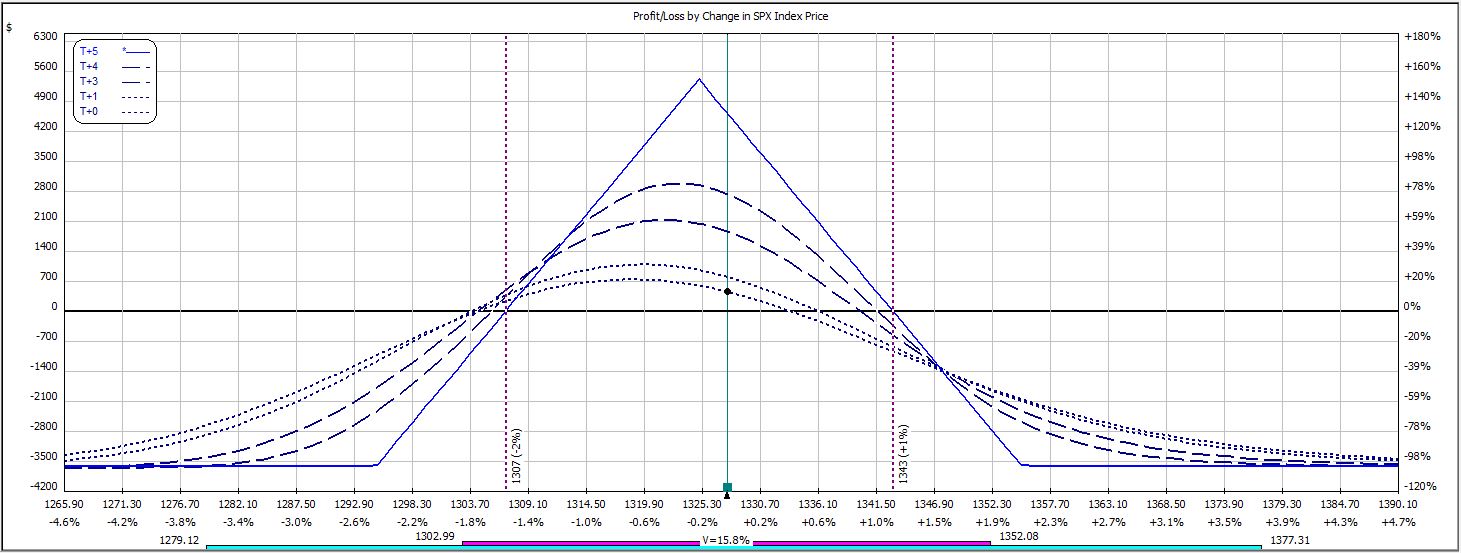
Weekly Iron Butterfly Backtest (Part 19)
Posted by Mark on July 31, 2013 at 07:05 | Last modified: August 25, 2013 12:14In this blog series, I’m backtesting the weekly option trade described here.
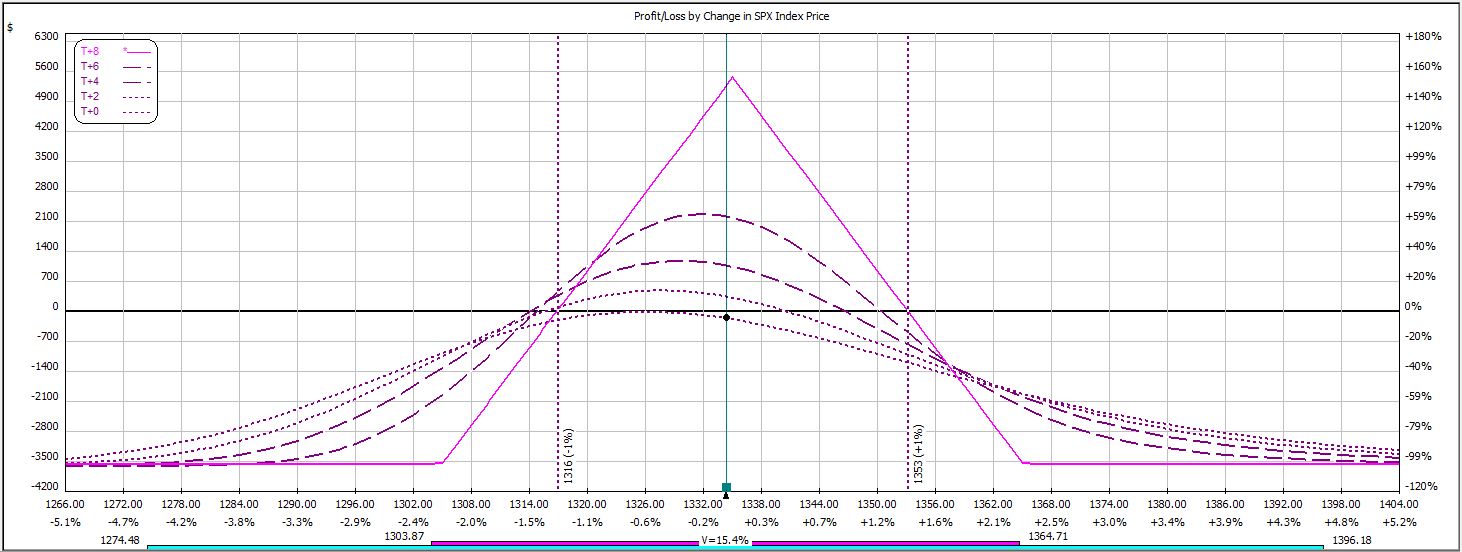
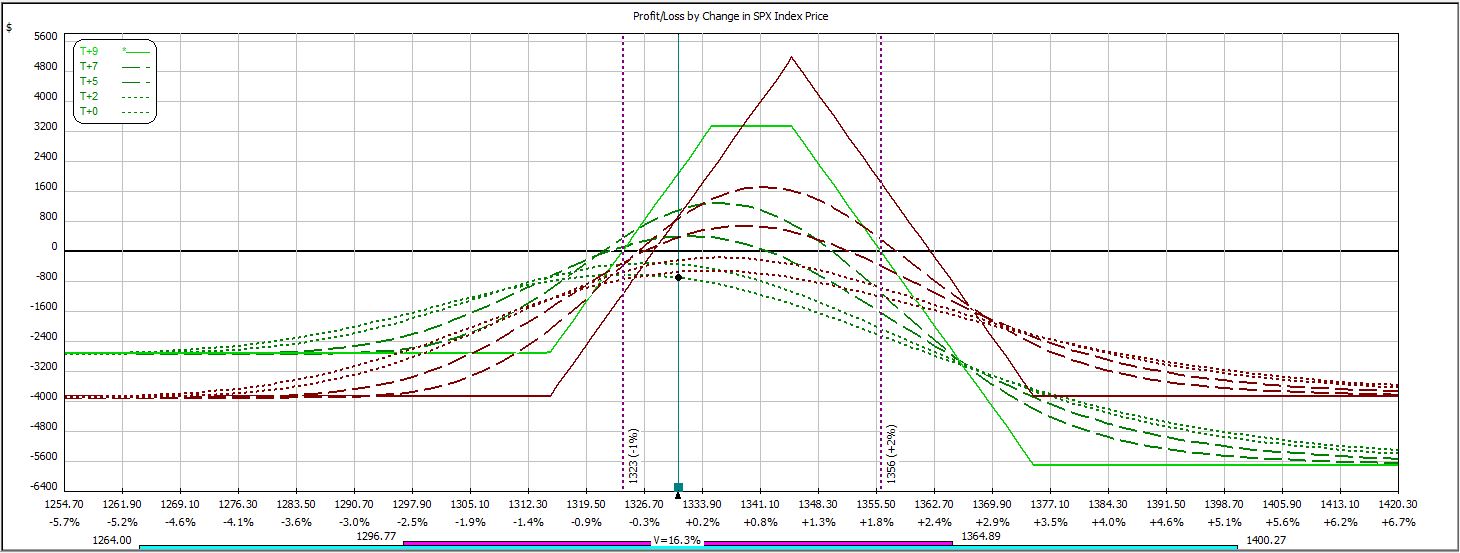
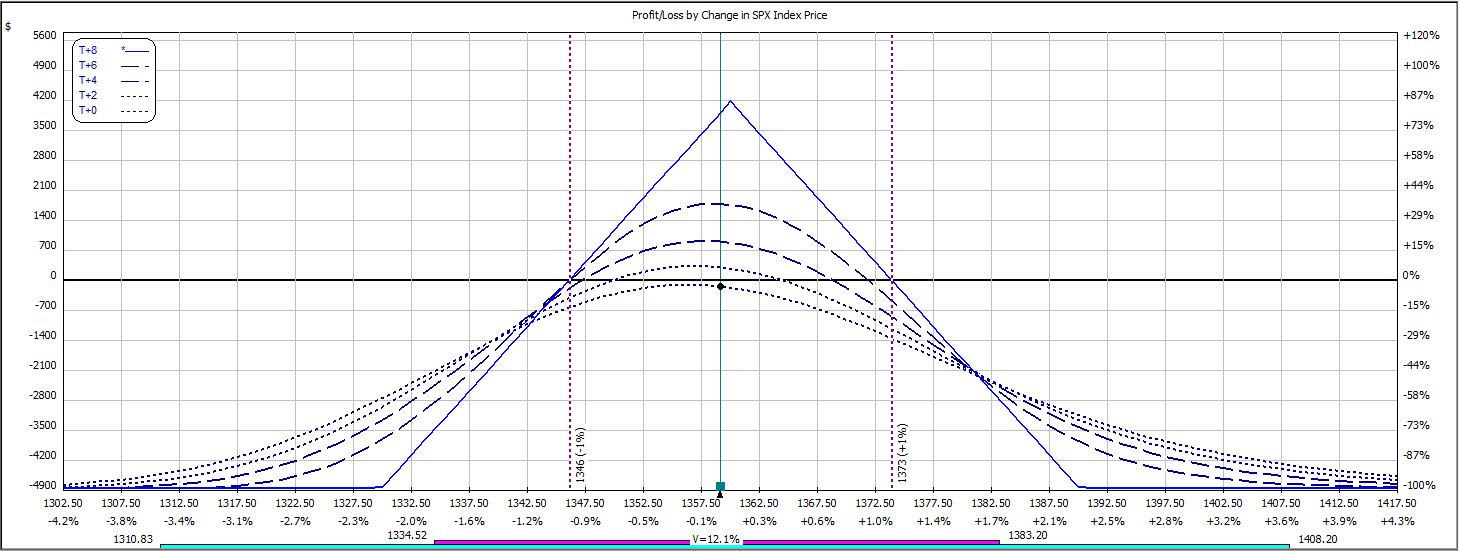
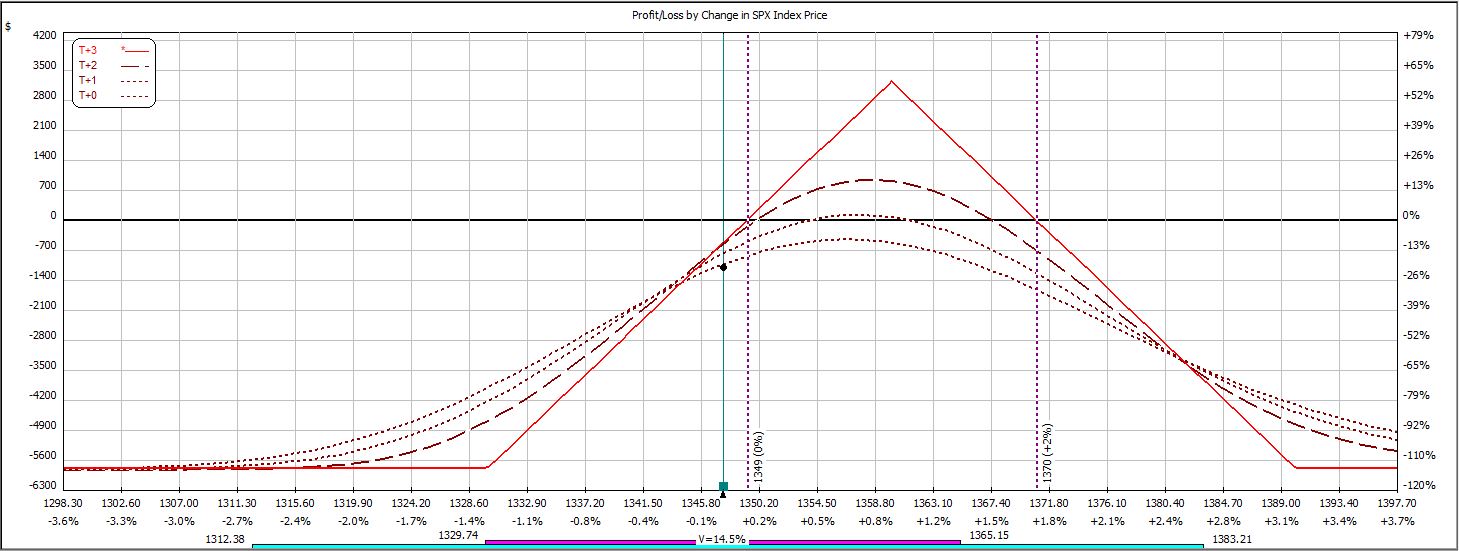
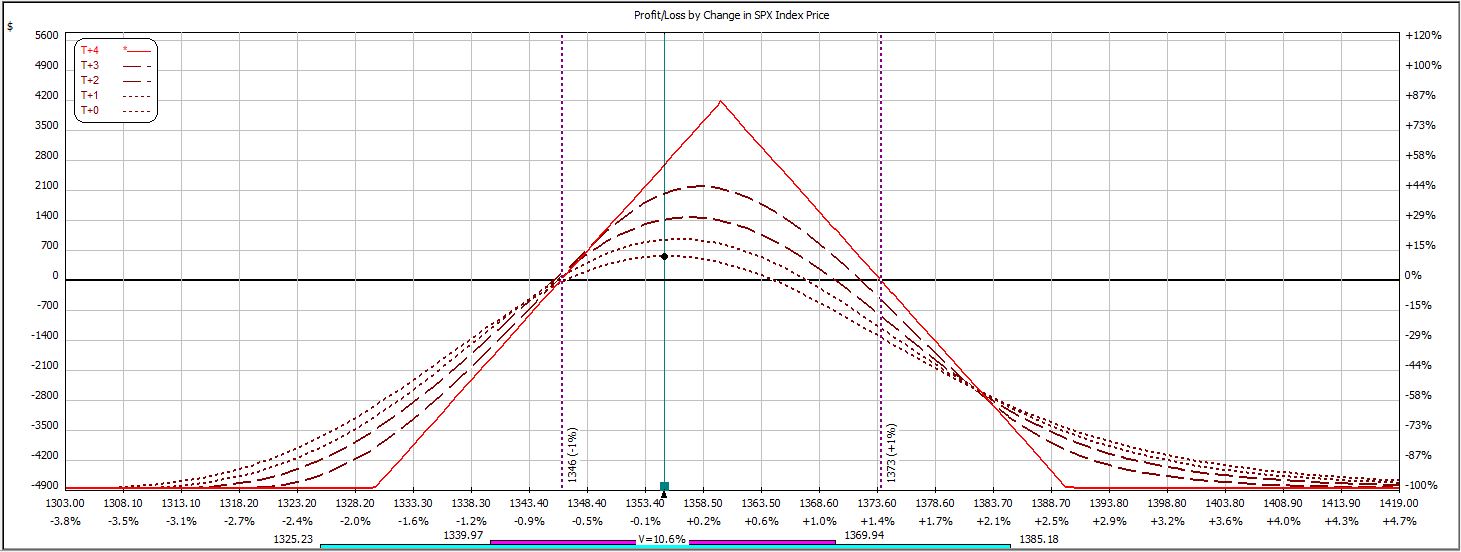
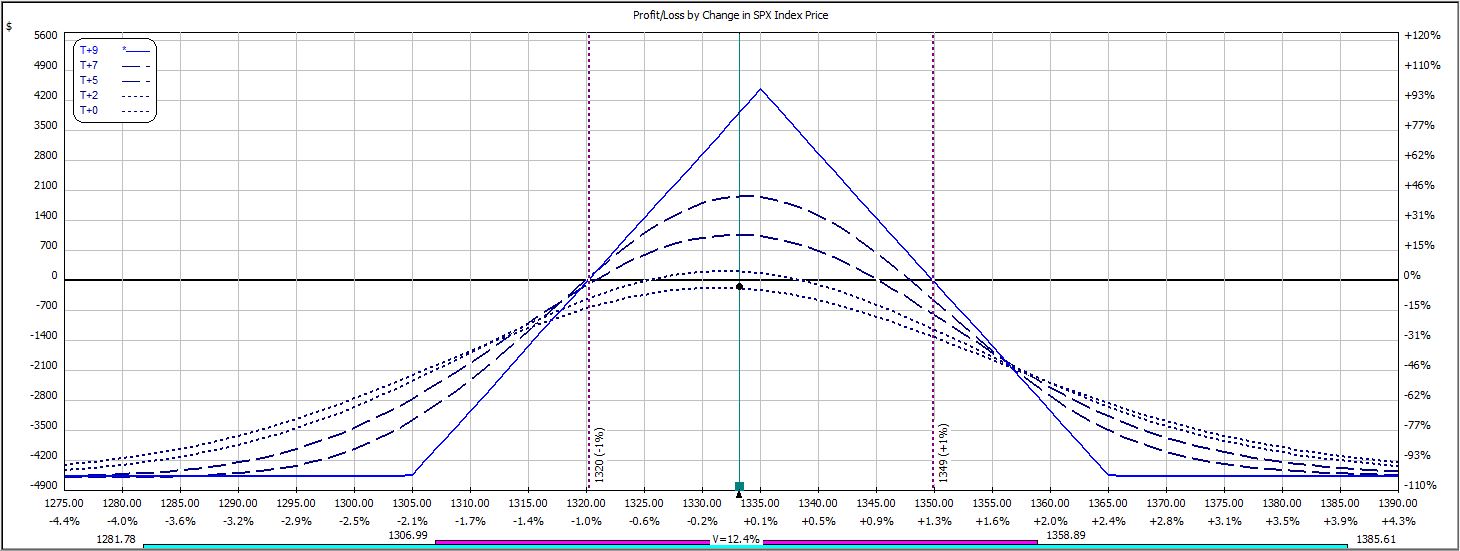
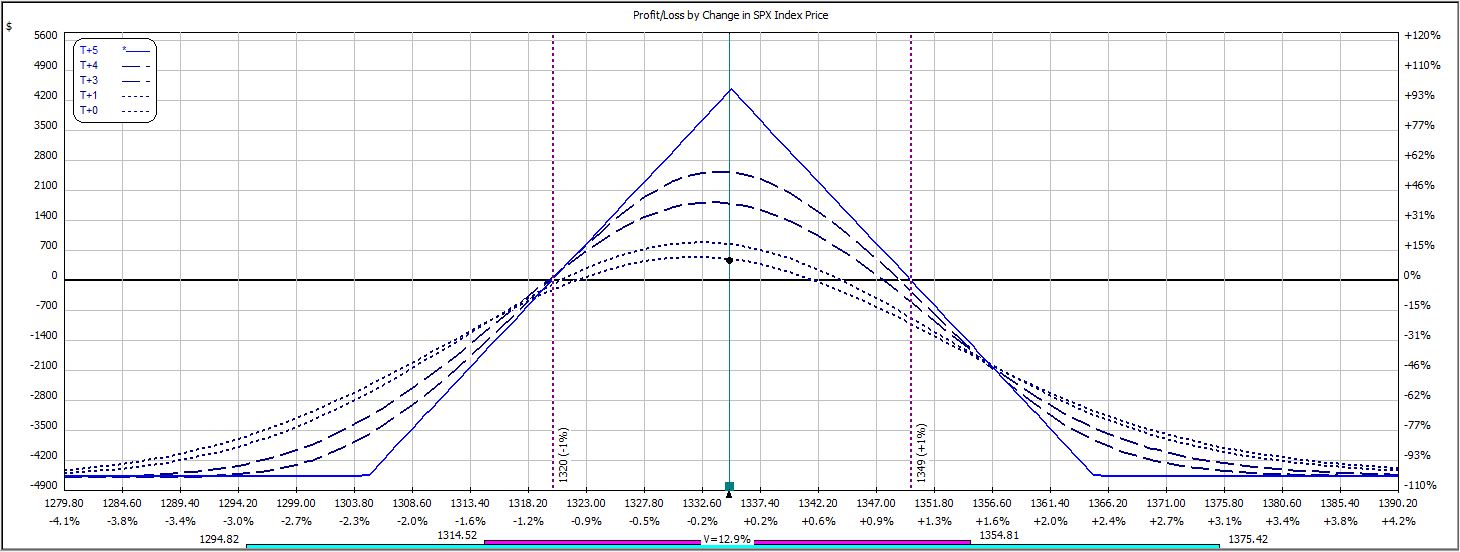
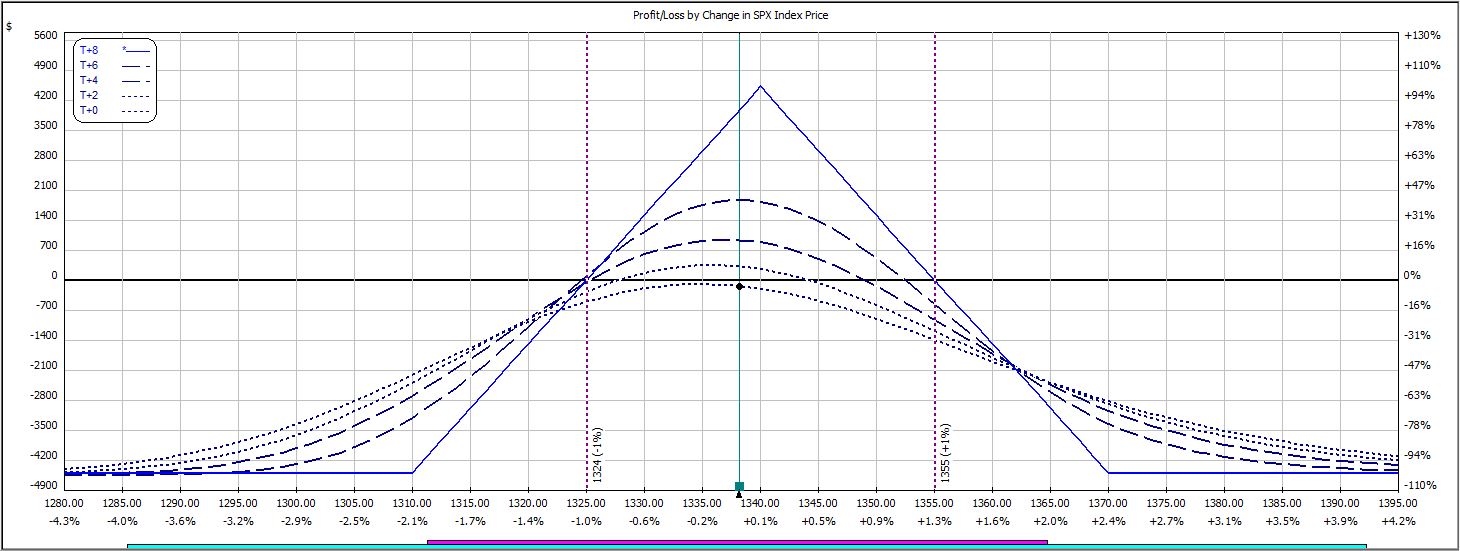
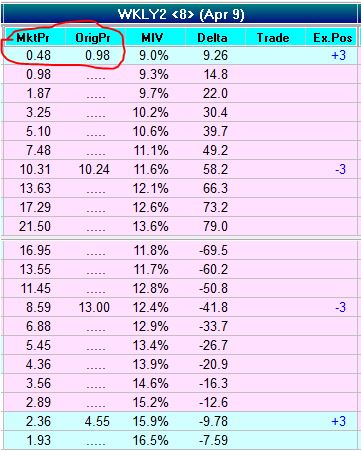
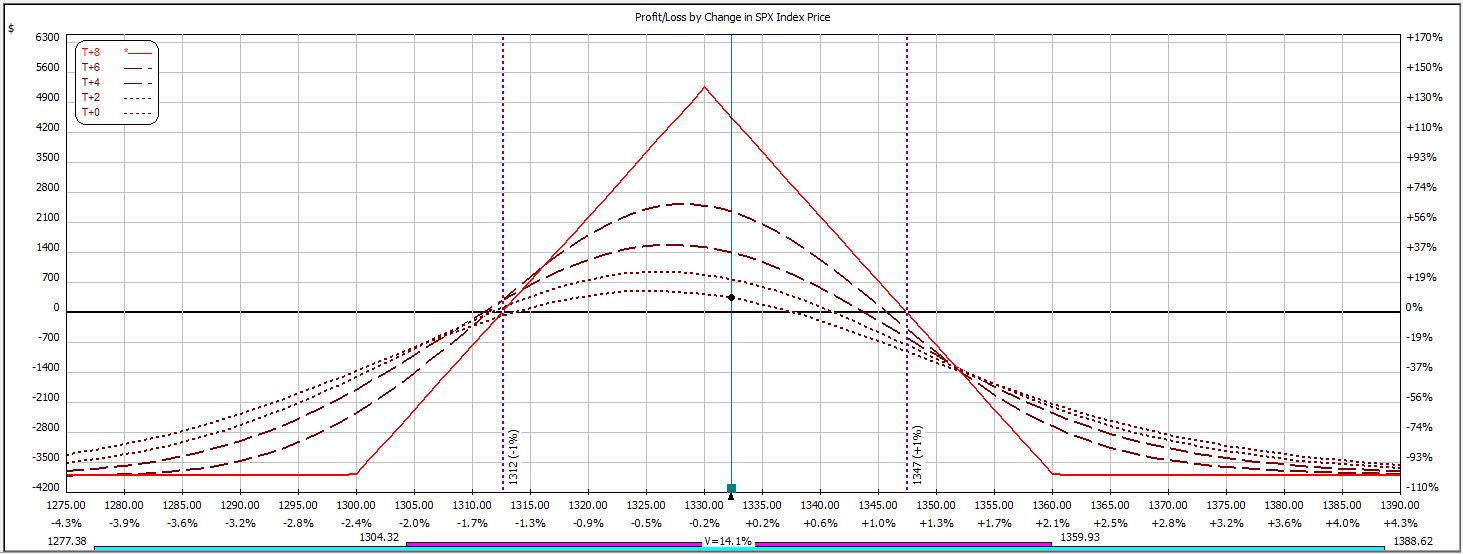
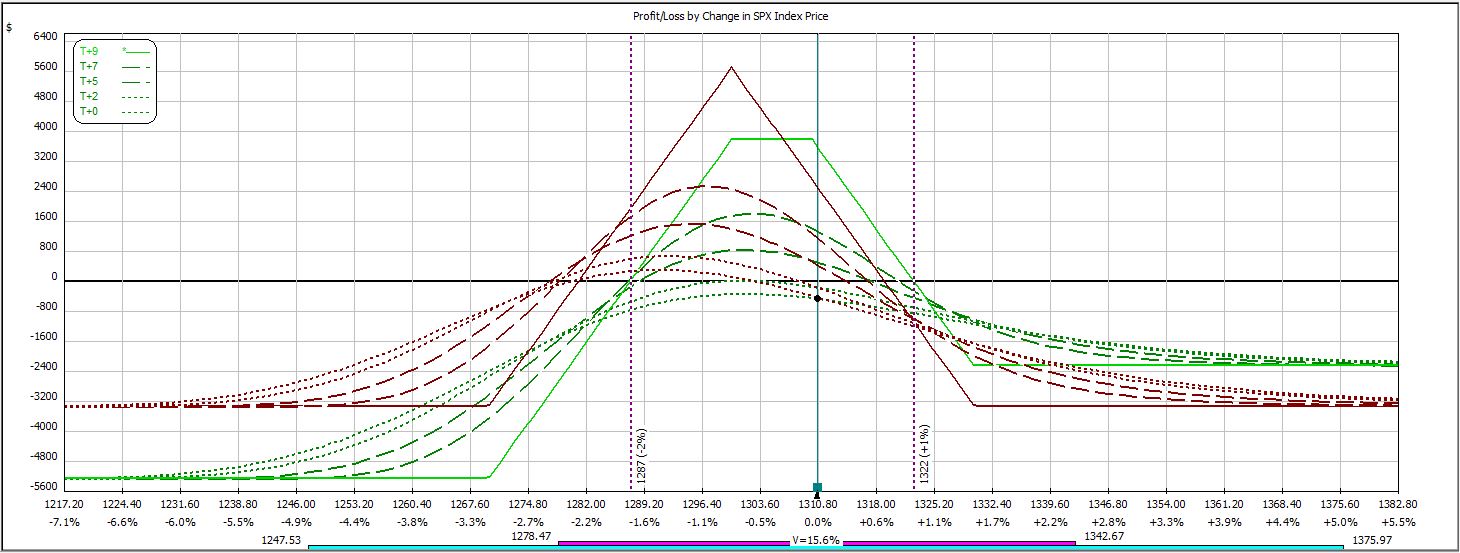
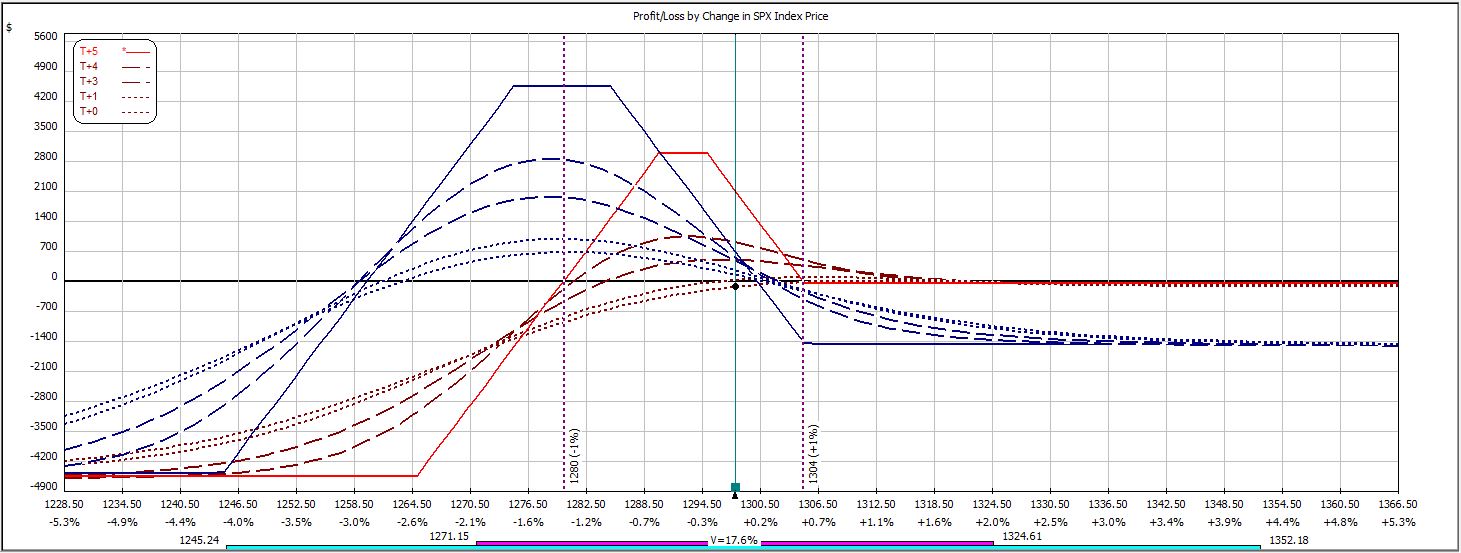
Week 18′s trade begins with this:
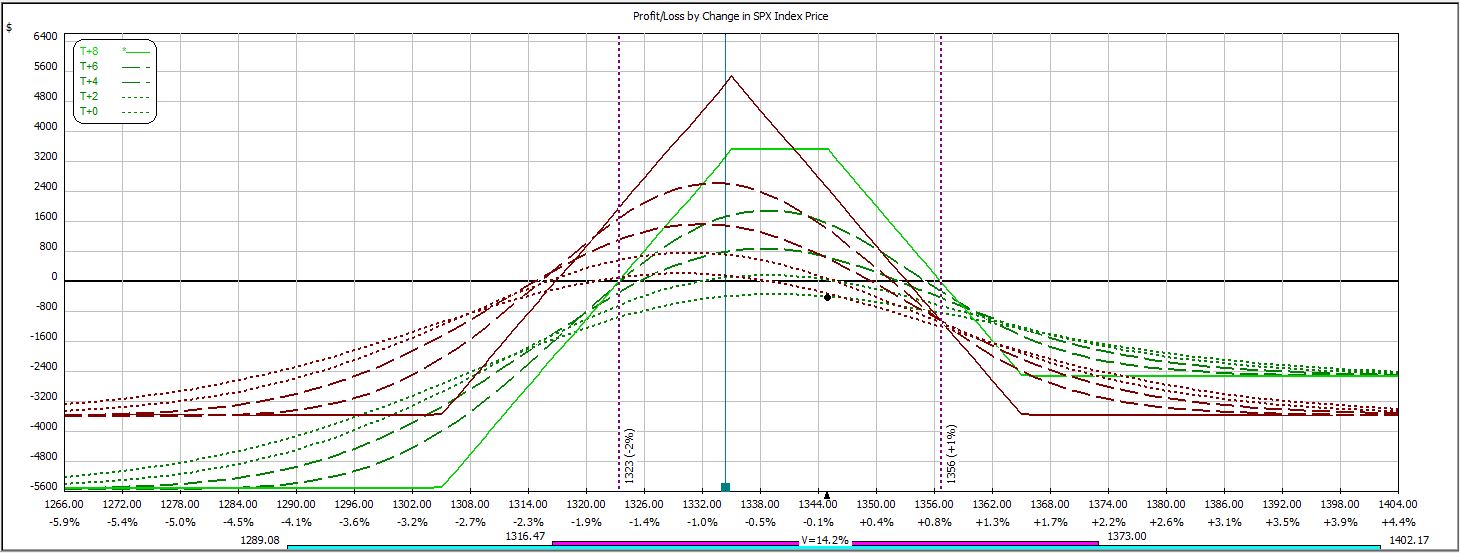
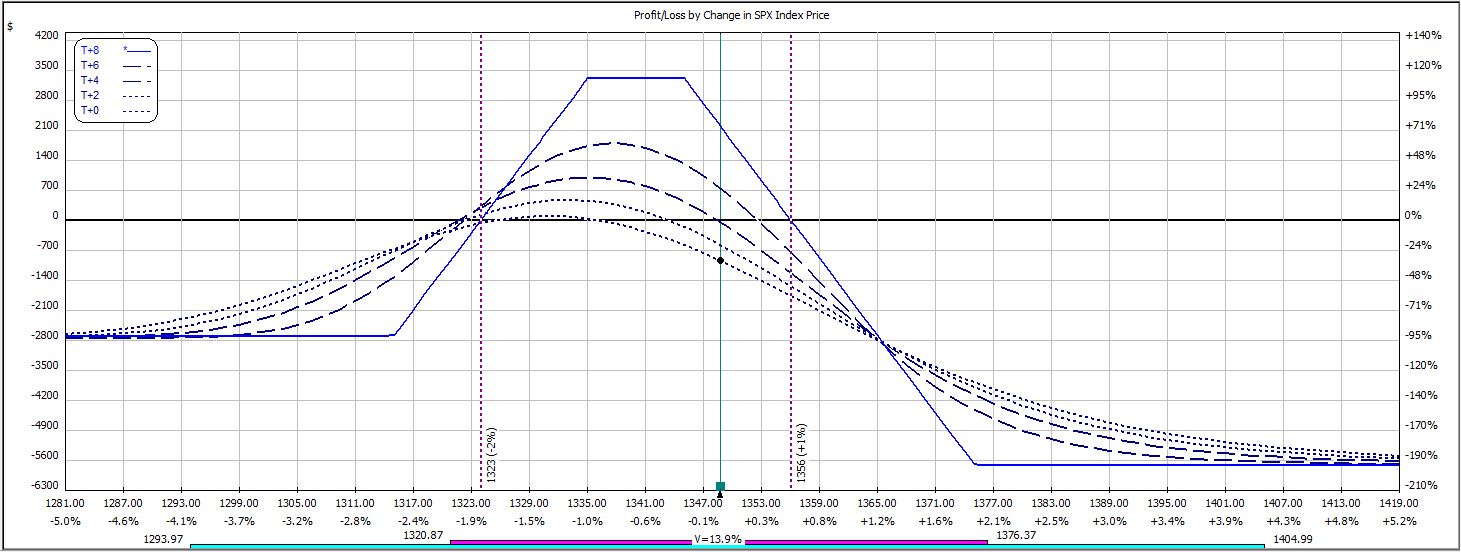
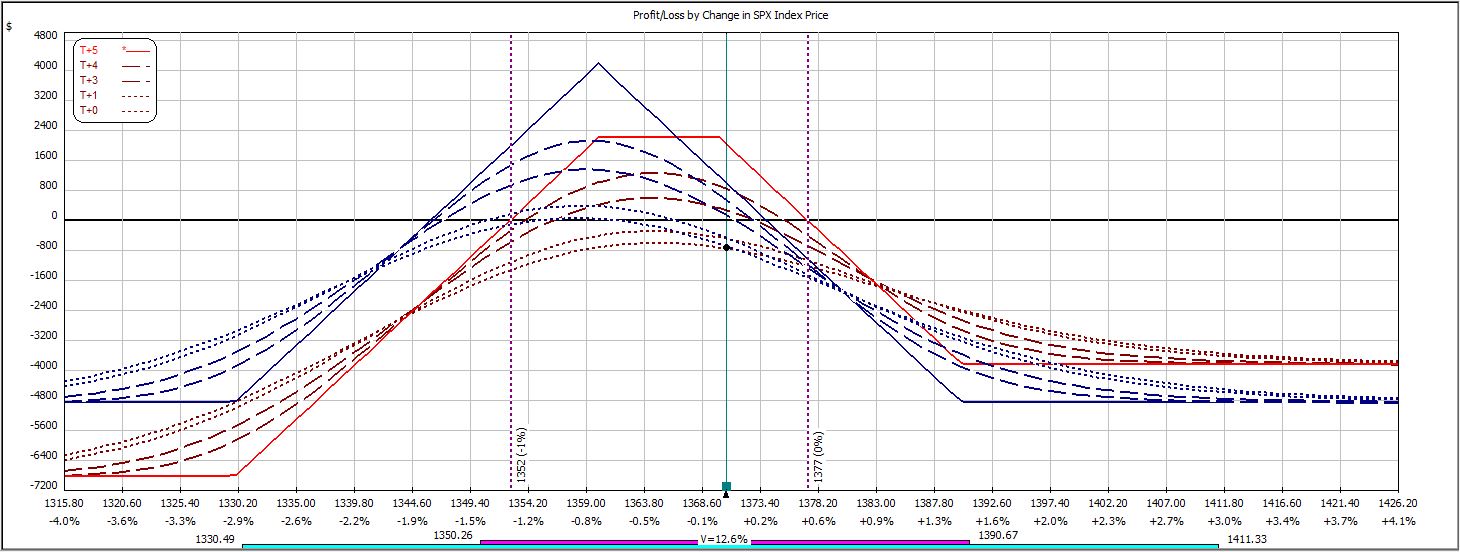
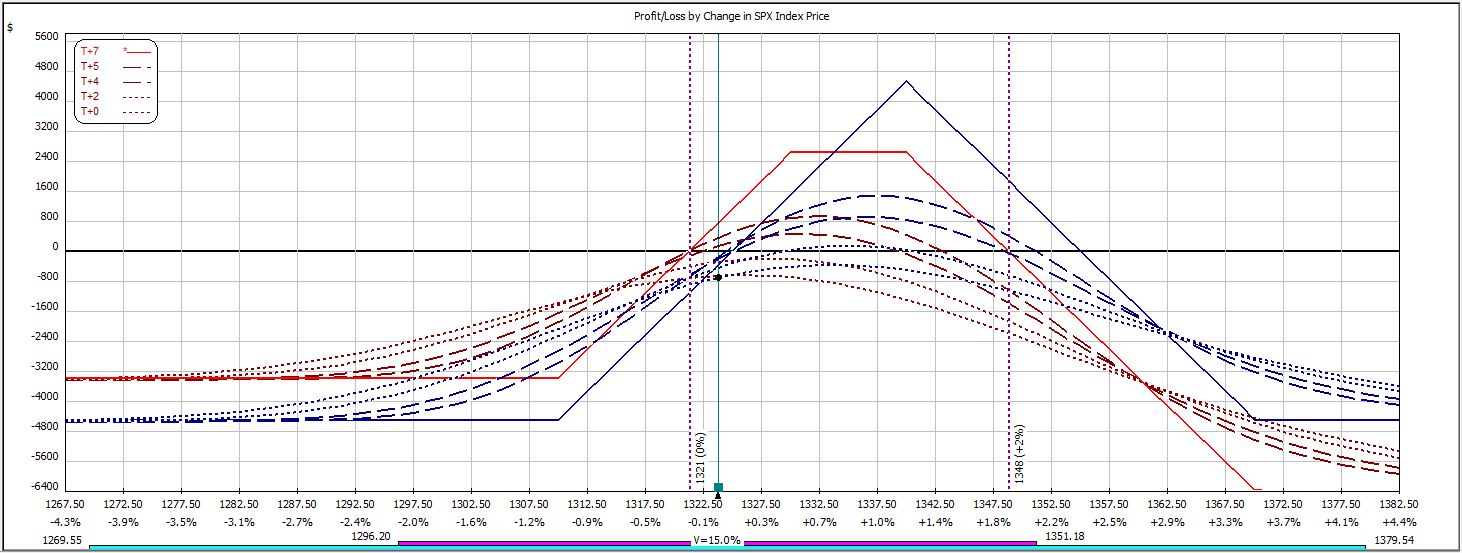
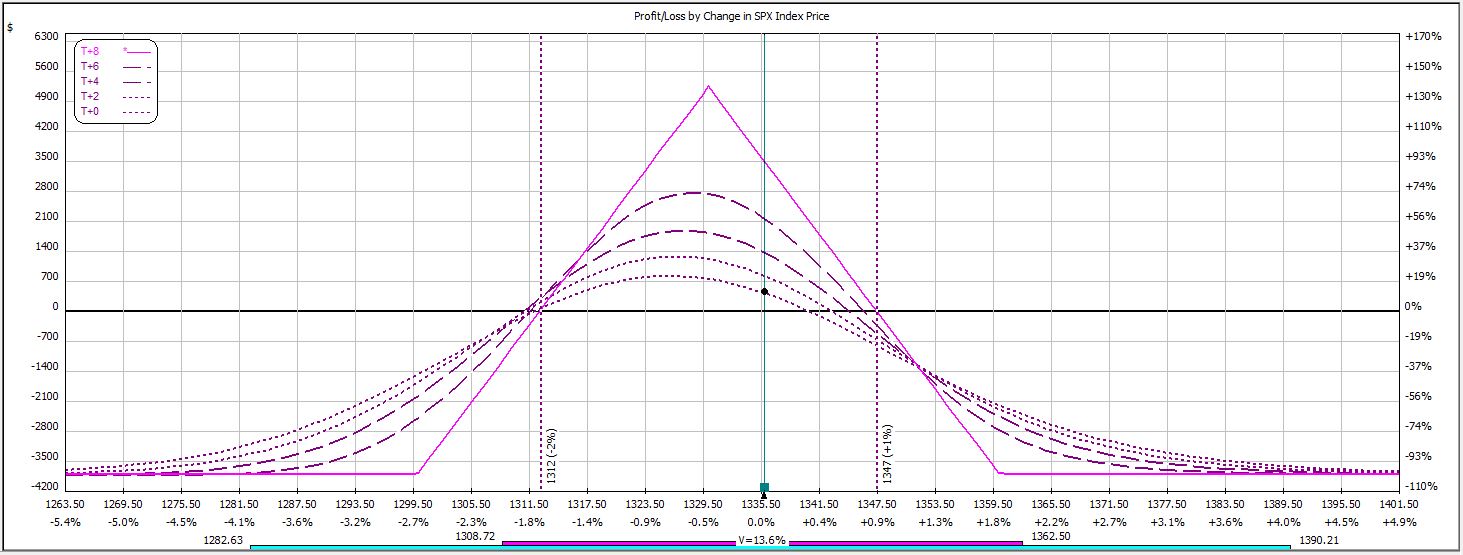
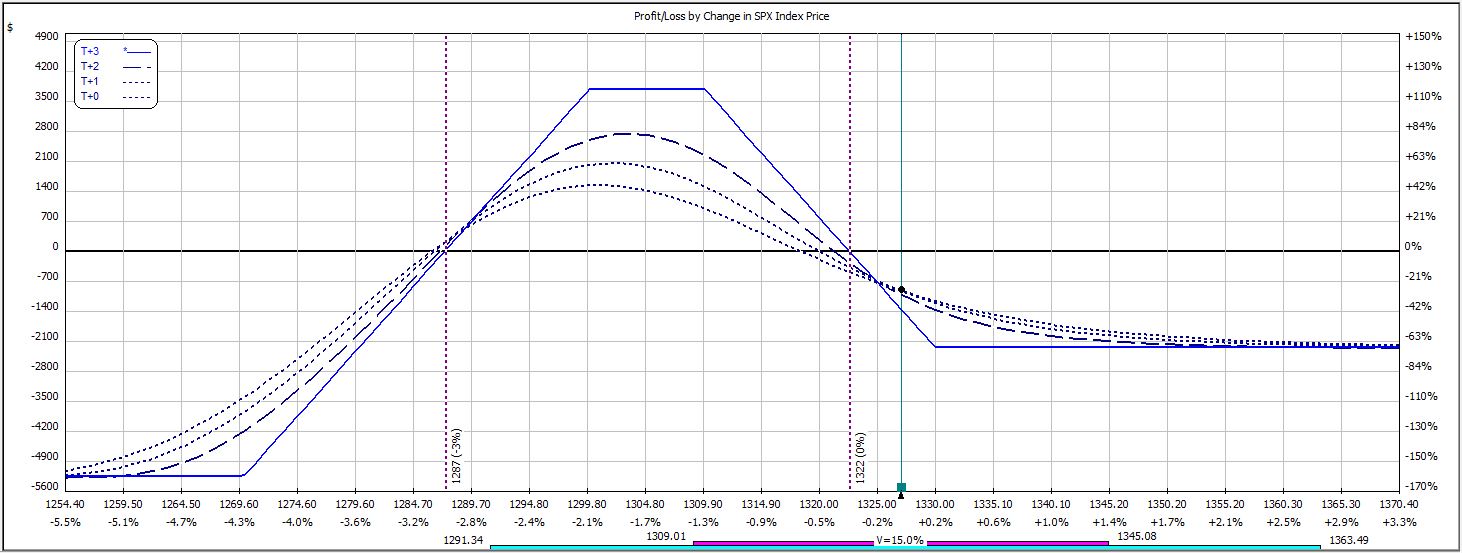
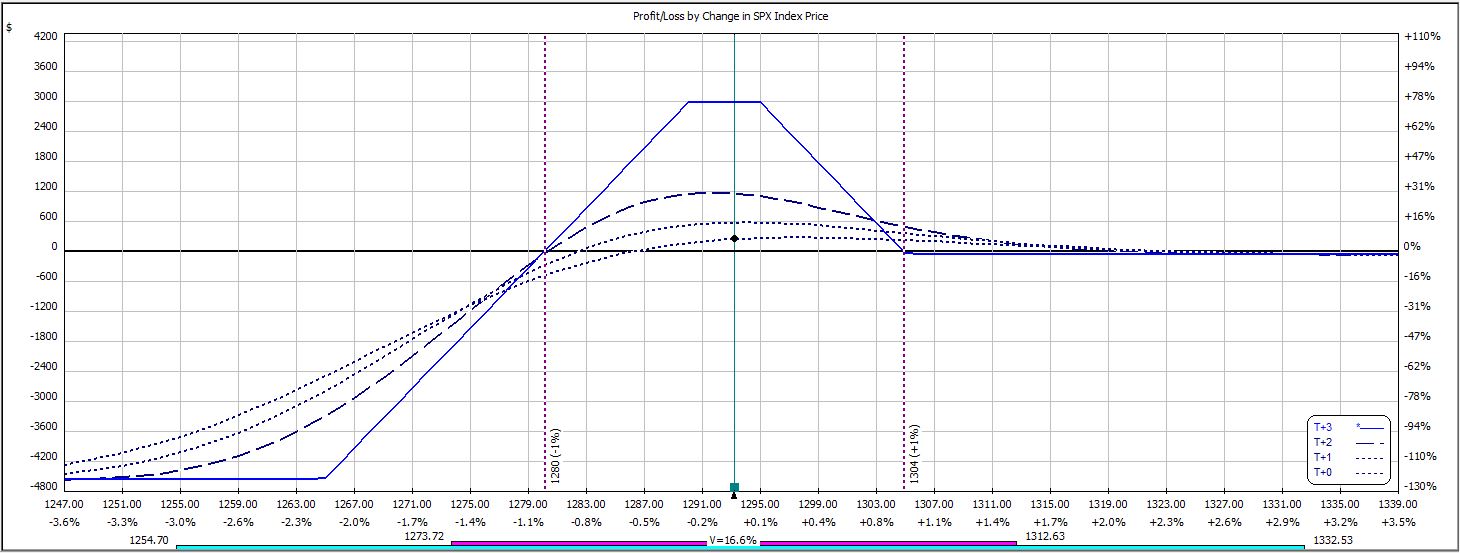
After opening the day down, the market recovered and pressed higher. This forced an adjustment:
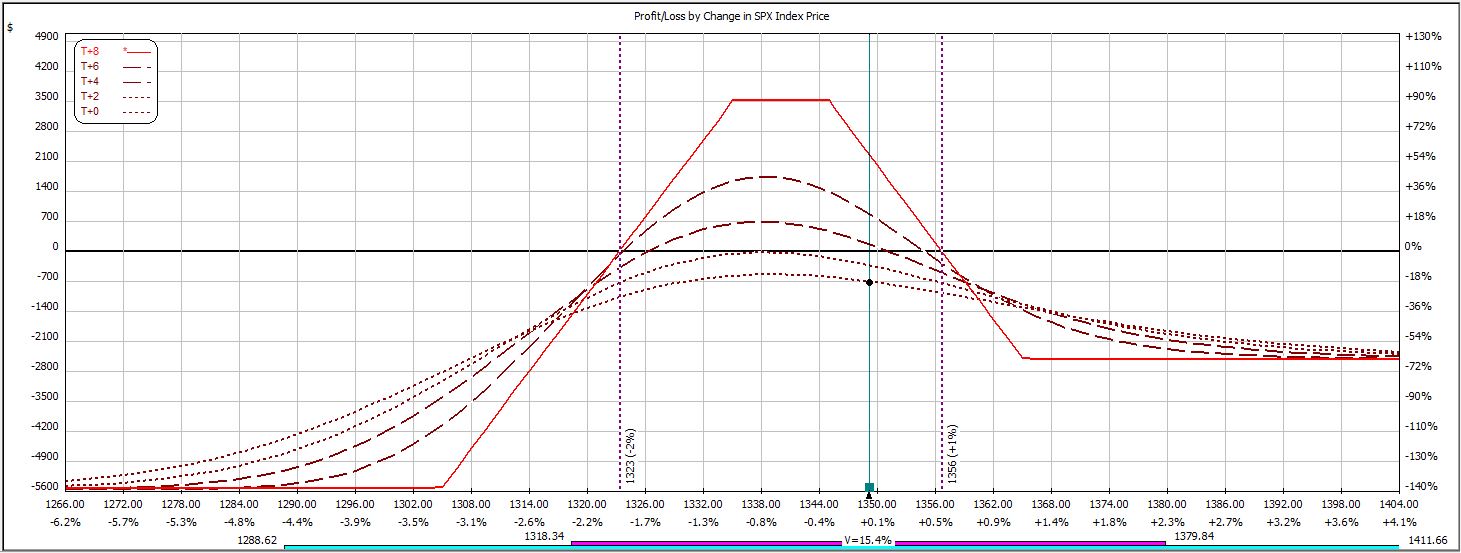
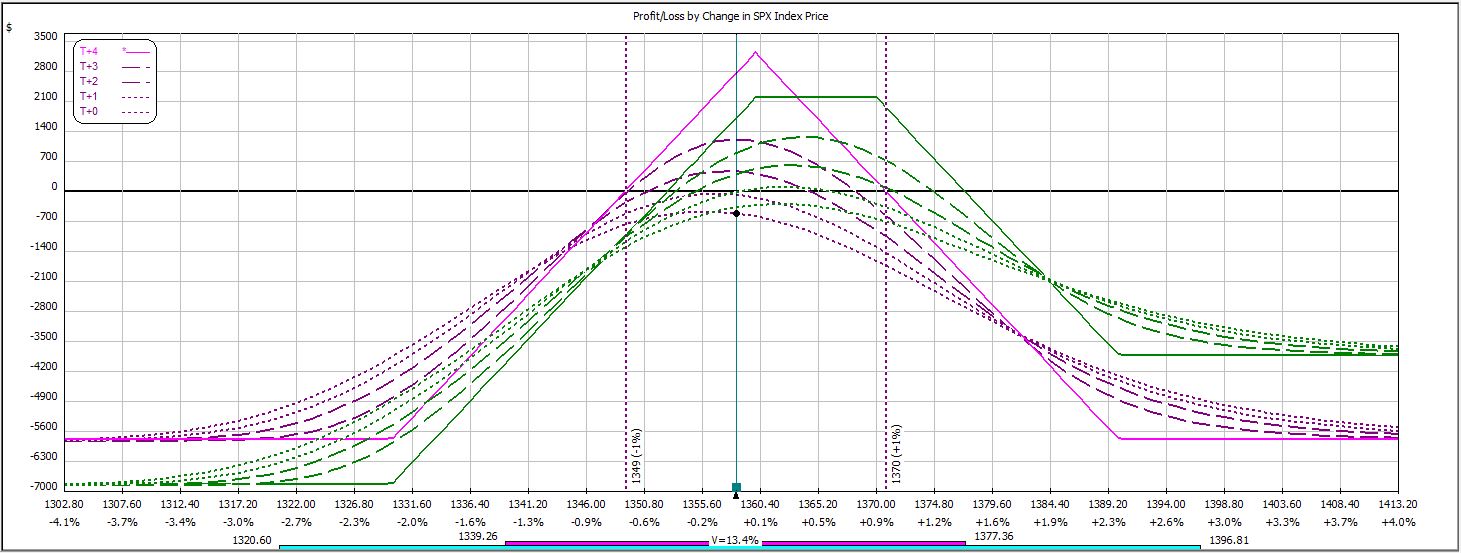
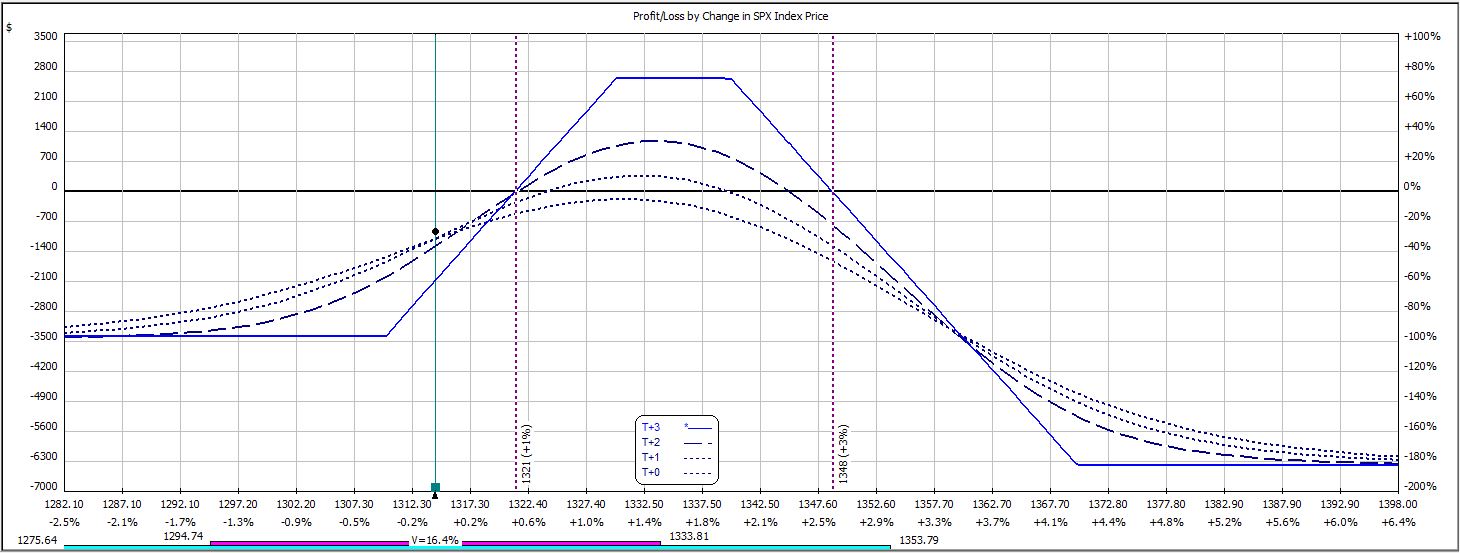
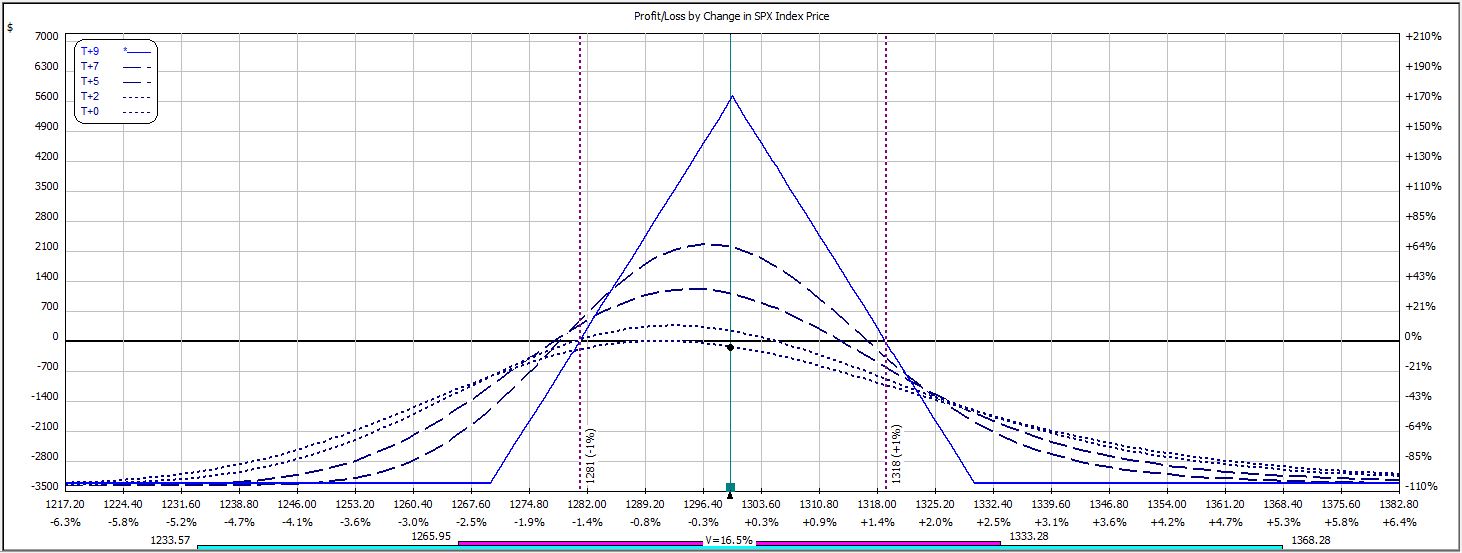
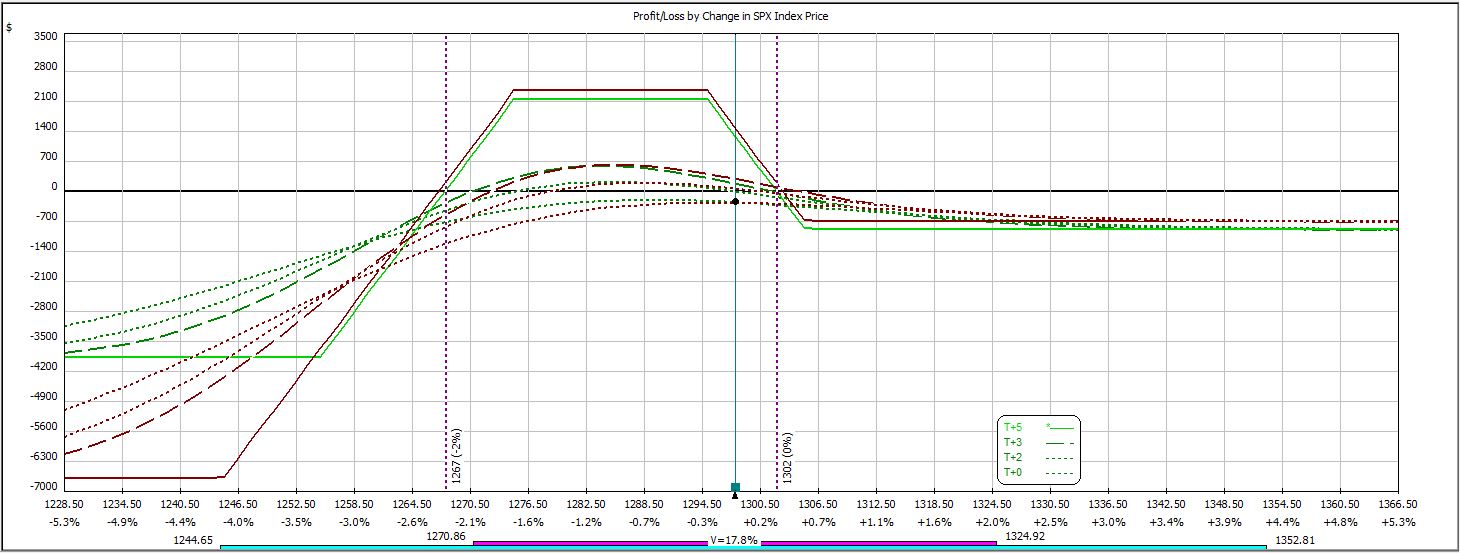
The market continued to move higher and max loss was reached just six hours after the trade was placed:
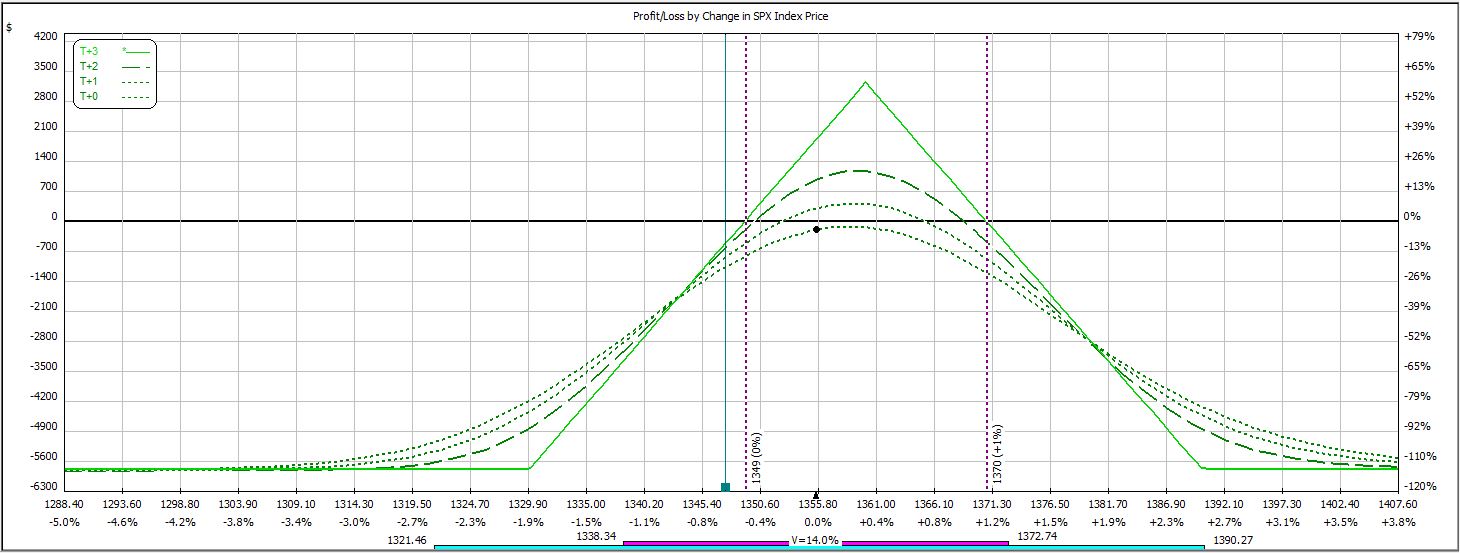
P/L ranged from -$12 to -$729, which is where the trade closed. On an adjusted margin requirement of $5,523, this is a 13.2% loss.
This trade has now won nine times out of 18 weeks. Unfortunately, the average win so far is $433 and the average loss is $936.
Categories: Backtesting | Comments (0) | PermalinkWeekly Iron Butterfly Backtest (Part 18)
Posted by Mark on July 29, 2013 at 07:50 | Last modified: August 8, 2013 09:06In this blog series, I’m backtesting the weekly option trade described here.
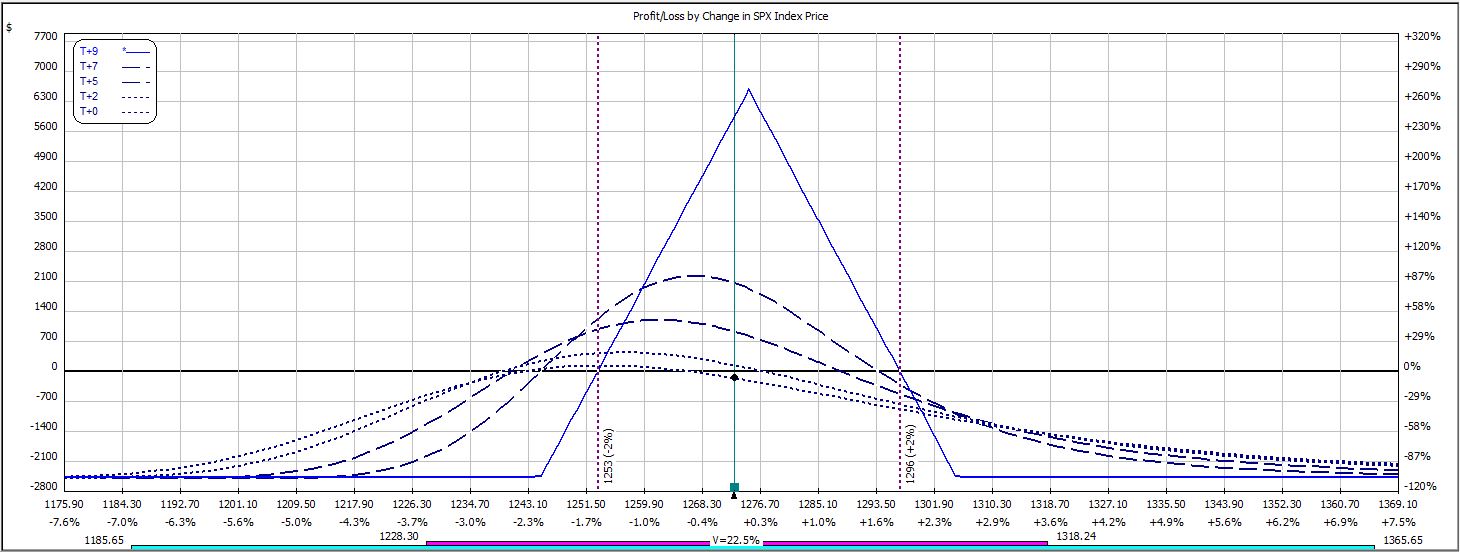
Week 17’s trade is the second consecutive classic example of a whipsaw. The trade starts with this:
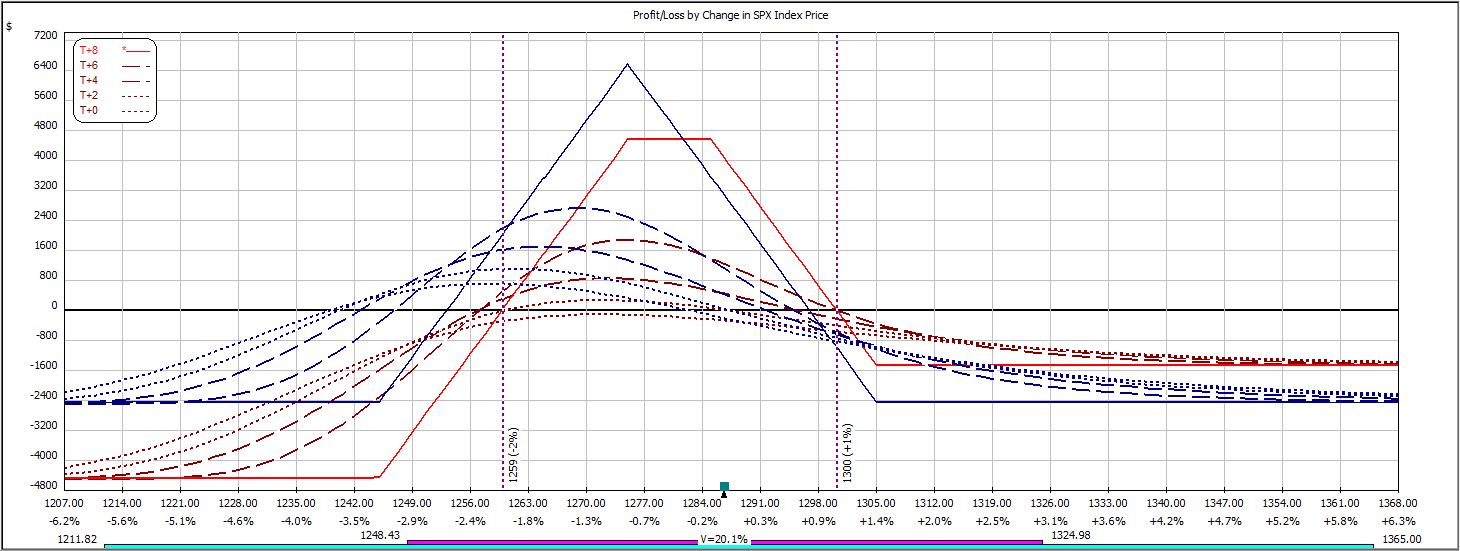
Near the close of Day 1, the downside adjustment is hit as the market has fallen over 10 points:
In the final 30 minutes, the market rallied to close within the original 10-point range. The adjustment has already been made, though, and on Day 2 the market continued to rally with conviction. The market gapped open five points higher and was another eight points higher shortly thereafter, which put this trade at max loss:
P/L on Day 1 ranged from -$737 to -$114 on an adjusted margin requirement of $5,712.
The trade closed on Day 2 with a max loss of $924, which is -16.1% on max margin.
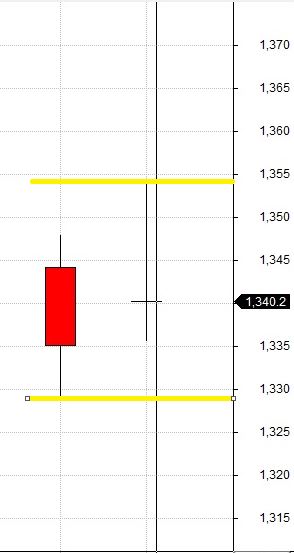
What is killing these trades? This week’s price action looked like:
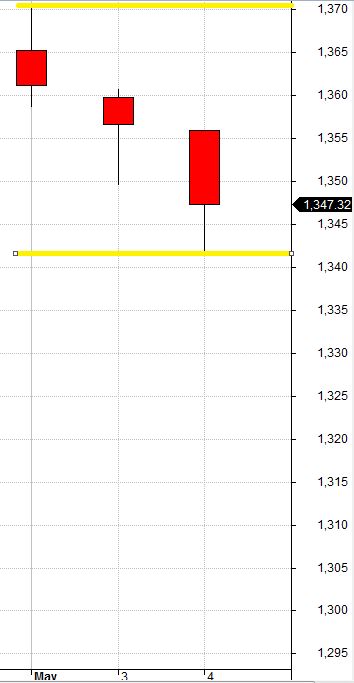
From the low of one day to the high of the next is a difference of over 25 points! Same goes for last week:
From one day’s high to the low two days later is over 25 points!
This trade adjusts every 10 points and cannot handle much more than one adjustment before max loss is reached. No wonder I’m having so much difficulty.
The trade has now won nine times out of 17 weeks. The average win, however, is $433 while the average loss is $961. A $15,000 account would be down 25.3% to date. The good news is that enough capital remains to continue running this trade (max margin ever seen is $7,137). The bad news is that unless what I’ve seen in these 17 trades is not representative of average market conditions, the account won’t be able to continue running this trade a whole lot longer.
Categories: Backtesting | Comments (0) | PermalinkWeekly Iron Butterfly Backtest (Part 17)
Posted by Mark on July 26, 2013 at 07:05 | Last modified: August 8, 2013 07:30In this blog series, I’m backtesting the weekly option trade described here.
For Week 16, OptionVue did not have weekly data for the Thursday before expiration week. I therefore started this trade on Friday:
The market rallied into Monday to force an adjustment:
Of all the rotten luck–this was the top! By the next day, the market had fallen 10 points back to its starting point. I adjusted back to the original trade:
Unfortunately, the market continued to fall. At Wednesday’s open, the trade looked like this:
This does not look bad. Look at the wand (turquoise vertical line) sitting far below the current price (black dot). That is how far the market fell just a short time later putting this trade at max loss:
P/L on Day 1 ranged from -$114 to -$366 on $4,854 margin.
P/L on Day 4 (nothing happened over the weekend) ranged from -$498 to -$765 on an adjusted margin requirement of $6,831.
P/L on Day 5 ranged from -$303 to -$777.
After opening Day 6 down only $180, this trade was closed for a loss of $1,101, which was -16.1% on max margin.
This is the classic case of being whipsawed. Had I never made the upside adjustment and then the second adjustment to undo the first, this trade would have hit its profit target on Day 5:
If only trading were that simple?
This trade has now lost seven out of 16 times.
Categories: Backtesting | Comments (0) | PermalinkWeekly Iron Butterfly Backtest (Part 16)
Posted by Mark on July 24, 2013 at 07:41 | Last modified: August 7, 2013 14:53In this blog series, I’m backtesting the weekly option trade described here.
Week 15′s trade begins like this:
This was a “manna from heaven” trade that closed the very next day:
P/L on Day 1 ranged from -$144 to +$273.
P/L on Day 2 ranged from +$351 to +$459, which is where it closed for a 10.1% return on $4,569 margin requirement.
This trade has now won nine out of 15 weeks in backtesting. Net P/L, however, is still in the red at -$1,773.
Categories: Backtesting | Comments (0) | PermalinkWeekly Iron Butterfly Backtest (Part 15)
Posted by Mark on July 22, 2013 at 05:29 | Last modified: August 7, 2013 14:38In this blog series, I’m backtesting the weekly option trade described here.
Week 14′s trade begins like this:
The market pulled back to force an adjustment just before the weekend:
On Tuesday as the market continued to drop, the trade was closed at max loss:
P/L on Day 1 ranged from -$144 to +$273 on a margin requirement of $4,512.
P/L on Day 2 ranged from -$729 to +$213 on an adjusted margin requirement of $6,393.
P/L on Day 5 (nothing happened over the weekend) ranged from -$303 to +$135.
The trade was closed on Day 6 for a loss of $933, which is -14.8% on max margin.
Out of 14 weeks of backtesting thus far, this trade has won eight times.
Categories: Backtesting | Comments (0) | PermalinkWeekly Iron Butterfly Backtest (Part 14)
Posted by Mark on July 19, 2013 at 07:35 | Last modified: August 7, 2013 14:26In this blog series, I’m backtesting the weekly option trade described here.
Week 13′s trade begins like this:
No long call data was available in the software for Day 1 of the trade. As a result, I entered three out of four legs and added the long call on Day 2. To ensure I was not paying too little for an option with eight days to expiration instead of nine, I purchased the long call for what it would cost to buy one strike closer to the money:
Here is the full trade after adding the long call:
This trade closed at the profit target later on Day 2:
P/L on Day 1 ranged from -$114 to +288, but this is not entirely accurate since the long call was missing.
P/L on Day 2 ranged from +$132 to +$462 on $3,795 margin requirement: a return of +12.2%.
This trade has been profitable in eight out of 13 weeks.
Categories: Backtesting | Comments (0) | PermalinkWeekly Iron Butterfly Backtest (Part 13)
Posted by Mark on July 17, 2013 at 04:34 | Last modified: August 5, 2013 14:55In this blog series, I’m backtesting the weekly option trade described here.
Week 12′s trade begins like this:
The market rallied during the day to force an adjustment near the close:
A couple short bursts to the downside over the next few days were not enough to hit the profit target. On Wednesday of expiration week, max loss was hit:
P/L on Day 1 ranged from -$480 to -$141 with an adjusted margin requirement of $5,250.
P/L on Day 2 ranged from -$624 to -$492.
P/L on Day 5 (nothing happened over the weekend) ranged from -$507 to -$312.
P/L on Day 6 ranged from -$243 to +$24.
Trade closed on Day 7 for a loss of $891, which is -17.0% on max margin.
The trade is 7-5 in backtesting thus far.
Categories: Backtesting | Comments (0) | PermalinkWeekly Iron Butterfly Backtest (Part 12)
Posted by Mark on July 15, 2013 at 07:54 | Last modified: August 5, 2013 13:59In this blog series, I’m backtesting the weekly option trade described here.
Week 11′s trade begins like this:
The market rallied and the next day, I rolled the short calls 10 points higher:
As the market continued to rally, I rolled the short calls 10 points higher on Day 5. To maintain profit potential in the trade and manage risk, I also rolled the short puts up 15 points and the long puts up 20 points:
The profit target was hit two days later:
P/L ranged from -$312 to -$72 on Day 1.
P/L ranged from -$270 to -$156 on Day 2 with an adjusted margin requirement of $4,476.
On Day 5 (nothing happened over the weekend), P/L ranged from -$231 to -$129 with an adjusted margin requirement of $4,557.
P/L ranged from -$96 to -$6 on Day 6.
P/L fell as low as -$165 on Day 7 with a final return of +5.9%.
I’m a bit leery of rolling the short puts higher when the market rallies. Rolling the long puts higher clearly lowers margin requirement for minimal cost:
While rolling the short puts higher does bolster profit potential, the profit target is so much less than the max potential profit at expiration that little benefit may be realized. The disadvantage to rolling up the short puts is a faster losing trade if the market reverses and lower.
The weekly iron butterfly is 7-4 thus far.
Categories: Backtesting | Comments (0) | PermalinkWeekly Iron Butterfly Backtest (Part 11)
Posted by Mark on July 12, 2013 at 06:10 | Last modified: August 5, 2013 11:30In this blog series, I’m backtesting the weekly option trade described here.
Week 10′s trade begins like this:
This trade closed in less than two hours at a profit target:
I’ve heard a number of traders talk about placing these weekly iron butterflies on Thursday and getting out before the weekend. This is the first time I have actually seen it in backtesting.
What happened?
The market was down 1.5% early on Thursday and IV had spiked 2.5%. The market traded sideways for the next 90 minutes and IV decreased 0.7%. This was enough to reach the profit target.
The margin requirement on this trade was only $2,556. The IV spike led to decreased cost of the butterfly spread. While getting out profitably in hours seems like a great thing, the downside is the lowest profit target seen thus far.
The trade has now won six times and lost four. Since the average loss outpaces the average win by a factor more than two, I am not ready to trade this with real money. We’ll see in time if the three consecutive losers were more the rule or the exception.
Categories: Backtesting | Comments (0) | PermalinkWeekly Iron Butterfly Backtest (Part 10)
Posted by Mark on July 10, 2013 at 05:21 | Last modified: August 5, 2013 10:34In this blog series, I’m backtesting the weekly option trade described here.
Week 9′s trade begins like this:
The market rallied and then pulled back over the next couple of days. While a downside adjustment point was hit on Day 2, I did not adjust because the trade was profitable:
The profit target was hit on Monday morning:
P/L on Day 1 ranged from -$372 to -$81.
P/L on Day 2 ranged from +$117 to +$285.
On Day 5 (nothing happened over the weekend), the trade was closed for a profit of $459 on a margin requirement of $3,618, which is a return of 12.7%.
This trade has won in five out of nine weeks thus far.
Categories: Backtesting | Comments (0) | Permalink