Position Sizing Implications of Multiple Open Positions (Part 3)
Posted by Mark on November 13, 2012 at 05:00 | Last modified: November 14, 2012 05:55In http://www.optionfanatic.com/2012/11/09/position-sizing-implications-of-multiple-open-positions-part-2, I continued exploration of problems presented with trading all S&P 500 stocks individually in lieu of the SPY ETF.
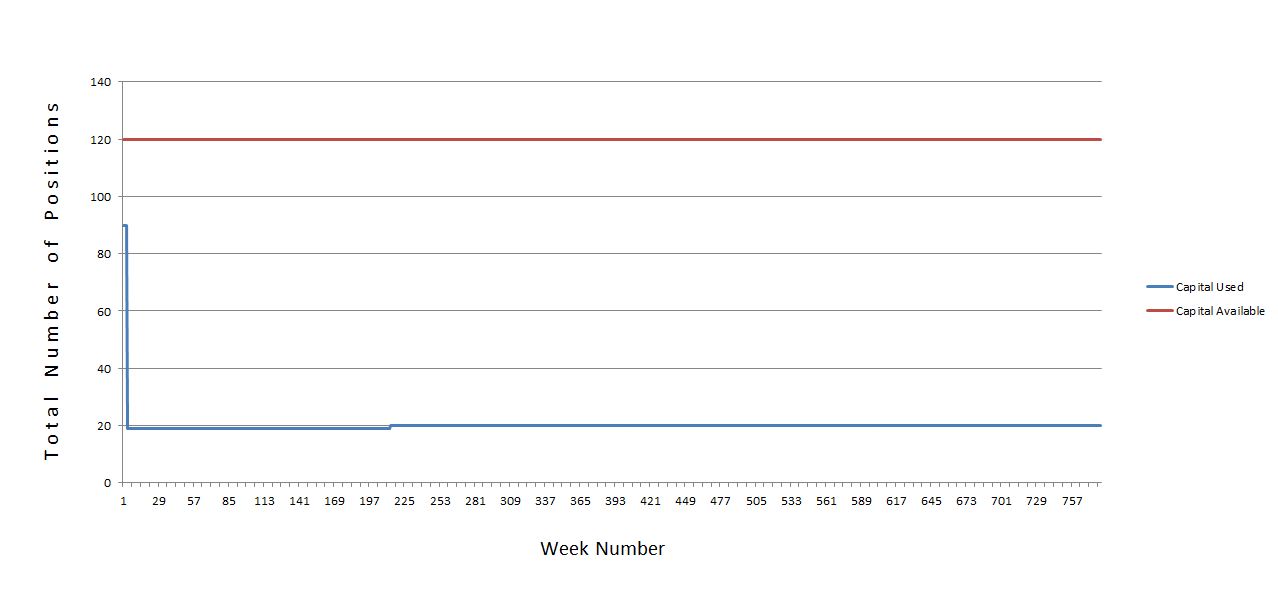
Last but certainly not least is the potential for large portions of capital to be sitting on the sidelines for extended periods depending on how the number of open positions is distributed over time. Suppose a 15-year backtest showed 90 trades to be open on three occasions for five trading days each and 20 positions to be open on average. To allow for a margin of safety, I might allocate for 120 positions. Here is a graphical representation of exposure:
Over 780 weeks (15 years), the space between the blue line and the red line represents capital sitting idle on the sidelines just in case the system ever needs it. That’s a lot of cash doing absolutely nothing but collecting 0.01% interest in today’s market environment.
Given this and the other problems/challenges discussed in the last two blog posts, my gut tells me to throw up my hands and say “forget it!”
Except for one thing. From http://www.optionfanatic.com/2012/11/08/position-sizing-implications-of-multiple-open-positions-part-1:
The goal of backtesting all S&P stocks and combining the results is to obtain data similar to trading SPY alone with a sample size large enough to be meaningful and not subject to outlier distortion. To do this, I will have to take every single trade since SPY is the composite of all 500 tickers.
I am not actually intending to trade all these individual stocks! I’m just trying to get results based on a large enough sample size to validate a SPY trading system. I don’t have to hold multiple positions. I don’t need a $50M account. I can let the computer simulate all this and then interpret the results for all 500 stocks as roughly equivalent (perhaps minus a constant tracking error for management fees) to the SPY ETF alone.
Categories: System Development | Comments (0) | PermalinkPosition Sizing Implications of Multiple Open Positions (Part 2)
Posted by Mark on November 9, 2012 at 05:59 | Last modified: October 26, 2012 13:08I left off http://www.optionfanatic.com/2012/11/08/position-sizing-implications-of-multiple-open-positions-part-1 discussing total financial commitment as a challenge for trading all S&P 500 stocks in lieu of SPY itself. When I look closer, another problem and challenge to system development also comes to the fore.
This second problem is unreasonable total risk. Trading SPY alone could cost $200 when risking 2% per trade on a position size of $10,000. Trading S&P 500 stocks individually means a potential total risk of 500 times that or $100,000. Don’t think for a moment that it couldn’t all be lost in one fell swoop with a sudden and substantial market move.
Rather than entertaining the possibility of 500 open positions at once, I could use the maximum number of open positions ever seen in the backtest. This would probably be fewer than 500. A problem would then arise if at some future time market conditions were to require more open positions than those for which I allocated.
Either possible solution to an instance demanding more open positions than allocation provides would cause problems from a system development perspective. I could simply skip additional trades once I’ve reached my limit. Alternatively, I could implement a rotational system where the top X trades are selected based on selected criteria. Either way, this is a rare and infrequent occurrence. With the total number of instances being so few and far between, the sample size would be too small to determine the trading system impact. To proceed blind without understanding the potential risk would be dangerous at best–this is the whole reason system development incorporates backtesting in the first place.
In an attempt to avoid being forced to open too many positions, I could allocate for more positions than the maximum number of positions ever seen in backtesting. While this would decrease the possibility of sequelae described in the previous paragraph, it certainly does not provide any guarantee.
Next up: a Sci-Fi twist and exciting conclusion.
Categories: System Development | Comments (0) | PermalinkPosition Sizing Implications of Multiple Open Positions (Part 1)
Posted by Mark on November 8, 2012 at 05:03 | Last modified: October 26, 2012 12:42In http://www.optionfanatic.com/2012/11/07/trading-system-2-consecutive-directional-close-part-4, I found sample sizes at the extremes (e.g. x = 5, x = 6, x = 7) too small to be useful in backtesting the Consecutive Directional Close trading system. What if I backtest the component stocks of the S&P 500 rather than SPY itself in an attempt to increase sample size thereby shrinking the error bars and producing more consistent data?
The goal of backtesting all S&P stocks and combining the results is to obtain data similar to trading SPY alone with a sample size large enough to be meaningful and not subject to outlier distortion. To do this, I will have to take every single trade since SPY is the composite of all 500 tickers.
A minimal position size is always required to overcome transaction costs. For example, consider a 2% profit target (reasonable for short-term trades held just a few days) and an $8 commission for each trade:
I can measure commissions as a percentage of profit or as a percentage of position size. Shaded in green are values that I, personally, would deem acceptable for each category. The point is that a minimal position size is required to prevent commissions from cutting too much out of profit thereby rendering the system untradeable. I certainly can’t trade a $500 position size, for example, where commissions alone would wipe out my profit target (and then some). In a complete analysis, slippage should also be considered.
The first problem with trading all S&P 500 stocks is an unrealistic total commitment. The “Total Portfolio Requirement” column above is Position Size x 500 since it is possible to have open trades in all 500 S&P stocks at one time. For most retail traders, this minimum capital required to overcome transaction costs becomes prohibitive long before a sufficiently large position size is reached.
I will continue this discussion in the next post.
Categories: System Development | Comments (1) | PermalinkTrading System #2–Consecutive Directional Close (Part 4)
Posted by Mark on November 7, 2012 at 07:14 | Last modified: October 30, 2012 09:45In http://www.optionfanatic.com/2012/11/06/trading-system-2-consecutive-directional-close-part-3, I began to analyze what turned out to be some confusing data. Today I will try to better sort this out and see if the Consecutive Directional Close (CDC) trading system is one to salvage or discard.
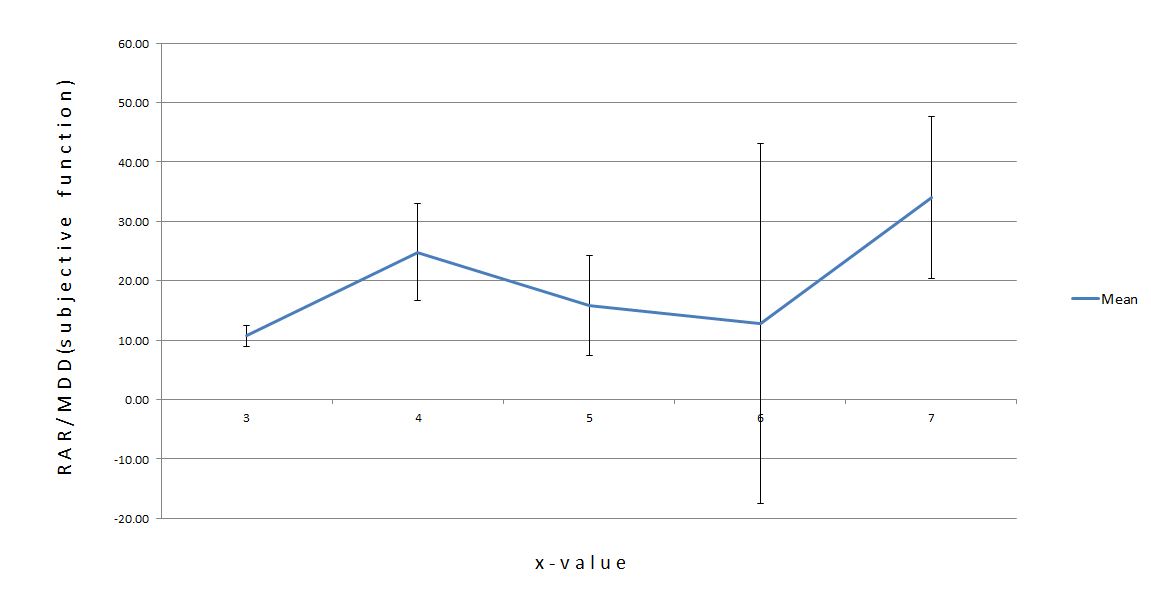
To refresh your memory, you may look back at Figure 1 and Table 2 from the last post. Here is a slightly different snapshot reflecting what I found:
This graph shows the mean RAR/MDD for x ranging from 3 to 7. To establish an x-value as “best,” one point must be separated above the others with no overlapping error bars. Because of the large error bars (especially on x = 6), no points show separation.
Are there any statisticians in the crowd? What is going on here?
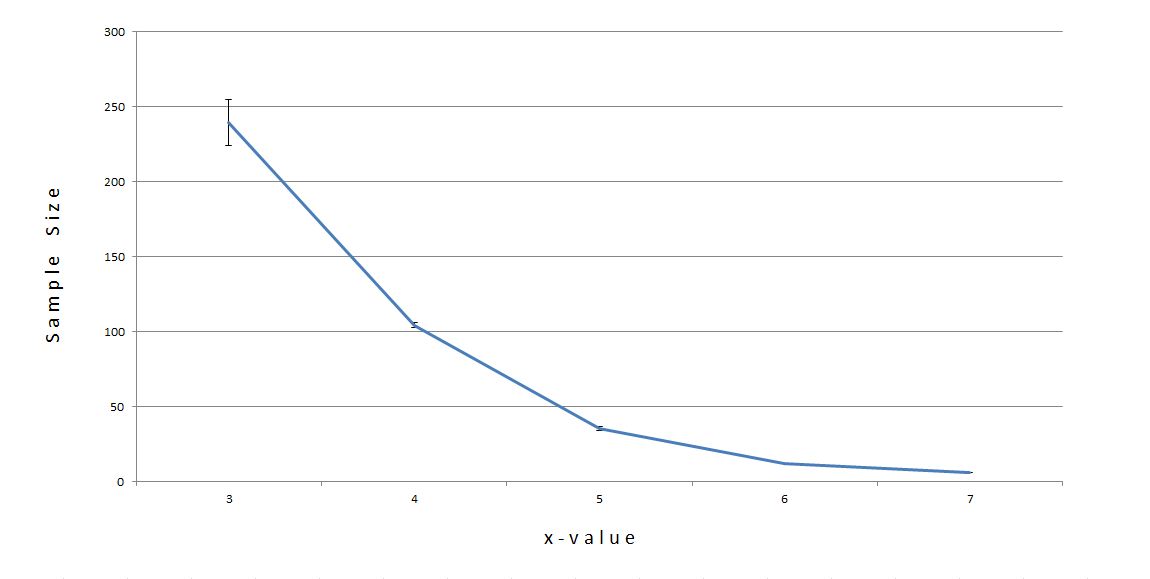
This is a problem with sample size:
The number of trades for x = 5, x = 6, and x = 7 were about 35, 12, and 6 respectively. Those numbers are too small for a valid sample size. I was not overjoyed with 57 trades in http://www.optionfanatic.com/2012/10/25/trading-system-1-spy-vix-part-9 but anything under 50 is totally unacceptable.
I must do something to increase the sample size from which to draw conclusions that may be predictive of future trading. To this end, I have two ideas. First, I can backtest other broad based indices and combine the results of all trades. Second, I can backtest the basket of 500 stocks that constitute the S&P 500 (SPY) separately. Although this may create more problems than it might solve, it can certainly be instructive for me to pursue.
I will continue with this analysis in my next post.
Categories: Backtesting | Comments (1) | PermalinkTrading System #2–Consecutive Directional Close (Part 3)
Posted by Mark on November 6, 2012 at 05:41 | Last modified: October 25, 2012 15:24In my last two posts, I talked about redundant trade signals. At this point I am going to ignore redundant signals to get a feel for how the Consecutive Directional Close (CDC) trading system performs all by itself.
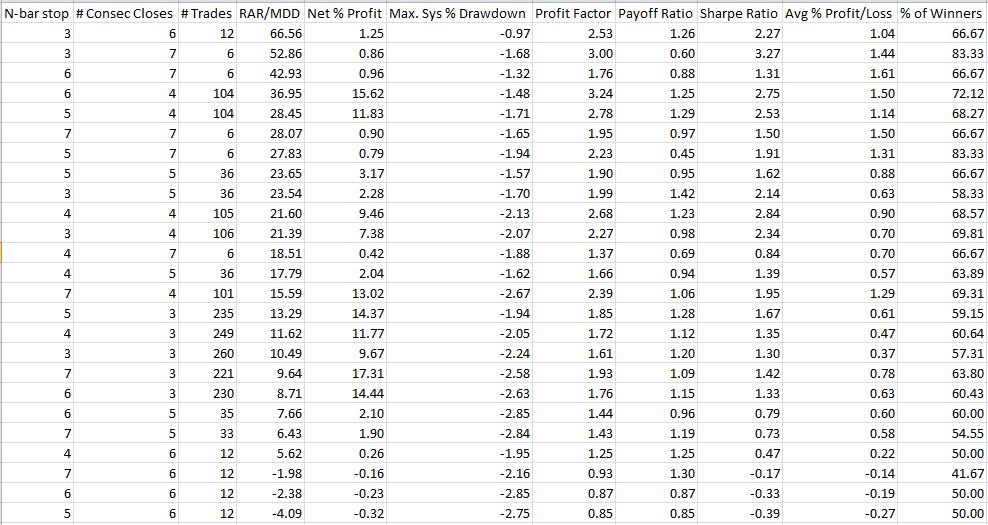
I began backtesting in http://www.optionfanatic.com/2012/11/01/trading-system-2-consecutive-directional-close-part-2 by studying x=3 and n=5. Now, I’m going to run an optimization to get a sense for backtesting results for x and n ranging between 3-7 (25 total systems). Just because I have another month of data, I’m going to extend the backtesting period to 9/30/2012:
Table 1
In contrast to http://www.optionfanatic.com/2012/10/02/trading-system-1-spy-vix-part-3-2, the first thing I notice here is that only 88% of these backtested systems were profitable. While 22 out of 25 is a high number, it falls short of the 100% I saw with the SPY VIX trading system.
The next thing I notice are some inconsistencies across x. This is a mean-reversion trading system and I would expect that more CDCs would result in larger returns. Indeed, the top three systems all had six or seven CDCs. However, the four worst-performing systems (including all three losers) also had six CDCs.
If I graph these numbers to check for plateau regions:
Figure 1
This is a much different graph than Figure 1 in http://www.optionfanatic.com/2012/10/11/the-subjective-function-part-5 where with a couple minor exceptions, the curve representing the most (least) extended trade condition was on top (bottom). Here, x = 6 starts out on top and dives into negative territory. x = 7 or x = 4 (can’t tell which) is below that followed by x = 5 and, as expected, x = 3 on the bottom (not really).
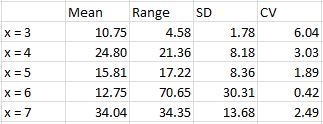
When I averaged across n-values, the statistics support the inconsistency:
Table 2
The huge range for x = 6 is seen here as it went from the best performing system to losing money. With higher CV (large mean and small SD) favorable, x = 3 looks impressive but its mean RAR/MDD is smallest and not very impressive.
I will continue this analysis with my next post.
Categories: Backtesting | Comments (2) | PermalinkRedundant Trade Signals (Part 2)
Posted by Mark on November 5, 2012 at 04:40 | Last modified: October 24, 2012 11:40I have been discussing the implications of allowing redundant signals to trigger additional positions once already in a trade. In http://www.optionfanatic.com/2012/11/02/redundant-trade-signals-part-1, I presented results for x=3 and n=5 with redundant signals allowed and compared this to results in Table 1 from http://www.optionfanatic.com/2012/11/01/trading-system-2-consecutive-directional-close-part-2. I’d like to conclude this discussion with a point about position sizing.
Taking additional trades with multiple signals makes the position sizing consideration much more difficult. Before, no more than $100K of risk would ever be present. With multiple signals, however, up to five positions may be open. Am I comfortable with up to $500K of risk being on the table or do I need to decrease position size? With greater risk, it makes sense that greater reward (net profit %) and greater DD could both be incurred. Perhaps max DD is still the best proxy for risk and what position size should be based on.
Performance calculations are also more difficult with multiple open positions. If you are able to trade five open positions at once then returns must be calculated on $500K (in the denominator) whether or not five positions were open during that time period. The capital must be ready to be deployed if it is needed.
Considerations about position size and redundant signals are examples of what make system development so difficult. Trying to balance profit potential with risk and exposure with position size can truly be a mind-boggling experience. I sometimes feel like I am chasing my own tail! Ultimately, I will stick with the subjective function (RAR/MDD) to choose the system for me and then position size from there. Every trader needs to do the same thing tailored to his/her own preferences.
In my next post I will continue analysis of the Consecutive Directional Close trading system.
Categories: System Development | Comments (0) | PermalinkRedundant Trade Signals (Part 1)
Posted by Mark on November 2, 2012 at 06:06 | Last modified: October 24, 2012 11:27In http://www.optionfanatic.com/2012/11/01/trading-system-2-consecutive-directional-close-part-2, I presented some initial results for the Consecutive Directional Close trading system with x=3 and n=5. Today I will continue discussion of overlooking redundant trade signals.
Redundant trade signals are buy or sell signals that occur once a trade is already open. They may be in the same or opposite direction as the original trade and they may be taken or ignored.
From a statistical perspective, I always wonder whether taking just the first signal in backtesting is biasing the results. If the system backtests profitably and I only took first signals then who isn’t to say in the future, results from the first signal wouldn’t be results from the second, third, or any other signal that may not be profitable? By taking all trades into consideration I might eliminate this bias.
On another hand, results from redundant signals might not be independent of each other. In case of a mean-reversion trading system where redundant signals represent greater and greater stretching of a rubber band likely to snap back to resting state, I would expect additional trades to be more profitable. To backtest only the first signal would therefore understate the results. This would be acceptable because if a backtested system looks good to me when understated then I feel more confident it will do well when traded live.
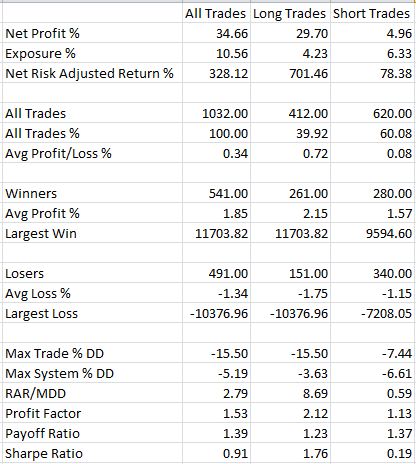
In contrast to Table 1 from my last post, here are the results with x=3 and n=5 when redundant signals are taken:
Total trades have increased from 458 to 1032 and net profit has increased from 13.82% to 34.66%. Short trades have increased to 60% of the total and with max system DD (MDD) up to -6.61% on the short side, the RAR/MDD has decreased from 3.80 to 2.79. Profit factor for longs still dwarfs that of shorts (2.12 to 1.13) so I would lean toward trading this long only if multiple signals were allowed.
I will conclude this discussion with a point about position sizing in the next post.
Categories: System Development | Comments (0) | PermalinkTrading System #2–Consecutive Directional Close (Part 2)
Posted by Mark on November 1, 2012 at 07:12 | Last modified: February 4, 2015 10:11In http://www.optionfanatic.com/2012/10/31/consecutive-directional-close-part-1/, I introduced the Consecutive Directional Close trading system. Today I will begin the backtesting in order to see whether this might be worth trading live.
For starters, I will backtest SPY with x = 3 and n = 5. Recall that the two variables are number of consecutive closes (x) either up or down to trigger a short or long trade, respectively, and the number of days to hold the trade (n).
Other backtest settings include:
–Initial account value $1M
–Position size $100K
–$8 commission for each transaction
–Date range 1/29/1993 through 8/30/2012
–Subsequent buy/sell signals ignored once in a trade
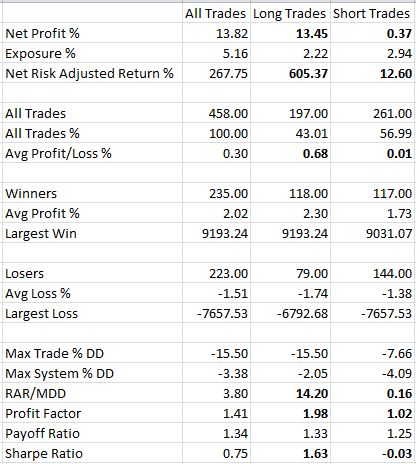
Here are the initial results:
With this variable combination, the system does look to be profitable but what really jumps out at me is a huge differential between long and short trades. Profit Factor for shorts is 1.02, which is barely profitable (probably not after slippage). Considering that 57% of all trades were short trades, I would strongly consider trading this long only, cutting exposure by 5.16% to 2.22%, and losing only a fraction of the net profit.
One thing I often wonder about is the final backtest setting to ignore subsequent signals once in a trade. Below are 10 consecutive trades beginning 6/12/2001 with this setting:
Contrast this with 10 consecutive trades beginning 6/12/2001 without this setting:
The yellow highlighting indicates subsequent trades that would not have been taken with the setting included. In the first case, an additional trade the following day compounded the initial loss. In the second case, additional trades taken on each of four successive days after the first resulted in a net profit rather than loss.
I will talk more about the implications of this in the next post.
Categories: Backtesting | Comments (3) | Permalink