Testing the Noise (Part 4)
Posted by Mark on September 13, 2019 at 06:16 | Last modified: June 10, 2020 11:36I am now ready (see here and here) to present detailed results of the Noise Test validation analysis.
The strategy counts by market are as follows:
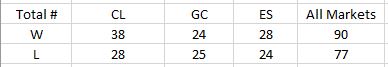
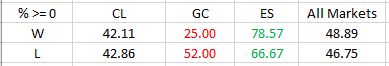
DV #1 (original equity curve positioning within the simulated distribution) breaks down as follows:
Frequencies are virtually identical for CL regardless of group (winning or losing strategies). Differences are seen for GC and ES with green and red indicating a difference as predicted or contrary to prediction, respectively. The more simulated curves that print above the original backtest, the more encouraged I should be that the strategy is not overfit to noise (see third graph here for illustration of the opposite extreme).
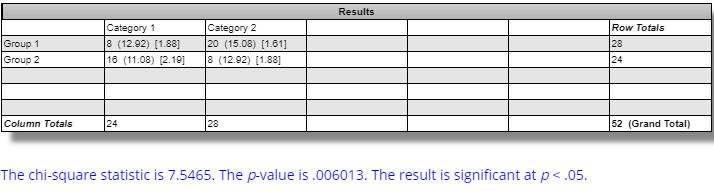
The difference in winning and losing strategies for ES is statistically significant per this website:
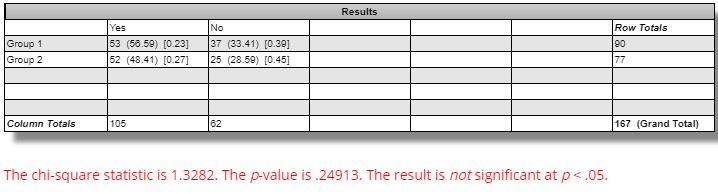
The difference between winning and losing strategies across all markets is not statistically significant:
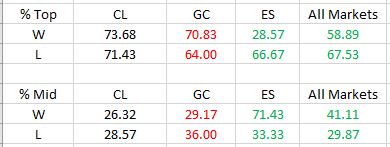
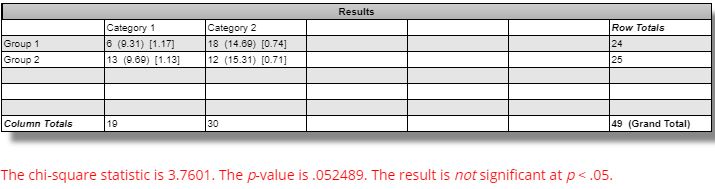
DV #2 (percentages of strategies with all equity curves finishing breakeven or better) breaks down as follows:
The difference seen between winning versus losing GC strategies is marginally significant (questionable relevance and even less so, in my opinion, due to smaller sample size):
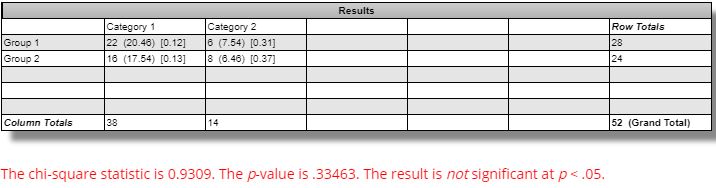
The difference seen between winning versus losing ES strategies is not statistically significant:
DV #3 (average Net Profit range as a percentage of original equity) breaks down as follows:
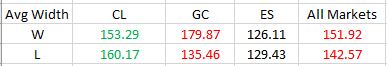
We should expect the simulated equity curves to be less susceptible to noise and therefore lower in range for the winning versus losing strategies. Across all markets, this difference is not statistically significant [(one-tailed) p ~ 0.15]. The difference for GC is statistically significant [t(49) = 2.92, (one-tailed) p ~ 0.003]: in the opposite direction from that expected.
Based on all these results, I do not believe the Noise Test is validated. The reason to stress potential strategies is because of a positive correlation with future profitability. I built 167 random strategies that backtested best of the best and worst of the worst. Unfortunately, I found little difference across my three validation metrics between extreme winners and extreme losers. My ideal hope would have been 12 significant differences in the expected directions. I may have settled for a few less. I got two with only one in the predicted direction.
Perhaps I could at least use Noise Test DV #1 on ES. I might feel comfortable with that if it were not for DV #3 on GC—equally significant, opposite direction—and an overall tally that suggests little more than randomness.
One limitation with this analysis is a potential confounding variable in the number of occurrences of open, high, low, and close (OHLC) in the [two] trading rules. My gut tells me that I should expect number of OHLC occurrences to be proportional to DV #3. A strategy without OHLC in the trading rules should present as a single line (DV #3 = 0%) on the Noise Test because nothing would change as OHLCs are varied. I am uncertain as to how X different OHLCs across the two rules should compare to just one OHLC appearing X times in terms of Noise Test dispersion.
I cannot eliminate this potential confound. However, this would not affect DV #1 and would perhaps only affect DV #2 to a small extent. More importantly, the strategies were built from random signals, which gives me little reason to suspect any significant difference between groups with regard to OHLC occurrences.
Categories: System Development | Comments (0) | Permalink