Short Premium Research Dissection (Part 24)
Posted by Mark on May 13, 2019 at 06:51 | Last modified: December 20, 2018 09:03I left off under suspicion of a major data flaw in the short premium research report. Today I take this one step further.
I am really trying to make sense of the fivefold MUP difference and its implications as discussed here. A direct consequence is the possibility of multiplying position size for the lesser, which would give the limited-risk strategy a much better total return. Multiplicative drawdowns (DD) could render this approach unfeasible.
Something still bothers me about the 2008 DD and why it’s only a few percentage points more for high risk. Maybe the small allocation (mentioned last time) and/or VIX filter are sufficient to explain this.
Tasty Trade (TT) has done a wide variety of research on many different concepts. I consider most of this anecdotal because like our author, they fail to disclose complete backtesting methodology.
Nevertheless, I found a segment from August 2015 that looked at high-risk trades closest to 45 DTE from 2005-2017. These trades were held to expiration. Results included:
- Average premium: $666
- Average PnL: $131
- Win ratio: 68%
- Largest loss: -$2679
I am most interested to compare average win with largest loss to see how long it might take to recoup losses from a severe DD. “Average PnL” is going to be weighed down by the losses. Here’s the algebra to solve for average L(oss):
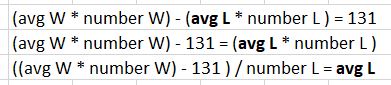
As I vary the average win, the average loss will vary proportionally:
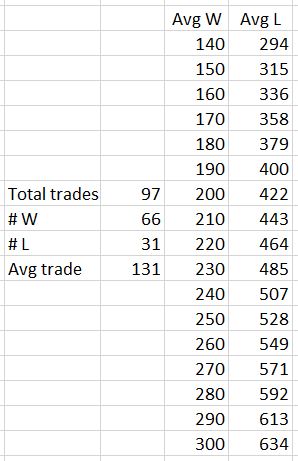
The 97 total trades is 12 years divided by 45 days/trade. The 66 wins corresponds to 68%.
Even assuming an average win of $260 (double the average PnL), the largest loss is still 10.3 times greater. Our author uses a 75% profit target with 60 DTE trades. The losses (and winners falling short of the profit target) will go a full 60 days. Per table here, if the 83% winners (exaggerated because some will likely fall short) take 75% of the total duration and the 17% losers take 60 days, then the average trade length would be 47.5 days. Ten trades (rounding down) to recoup the largest loss would take 475 days, which is over one year three months. That is with exaggerated assumptions. The Part 15 graph, however, shows it taking less than one year to reach new equity highs once trading resumes.
Another red flag appears for me, then, if the largest loss is not filtered out. The high-risk strategy’s 2008 drawdown should be worse than that shown.
With the limited data and methodology given to us by our author, I can’t prove anything wrong here. Maybe 75% winners take less time. Perhaps the largest loss is filtered out. Just by eyeing the VIX chart:
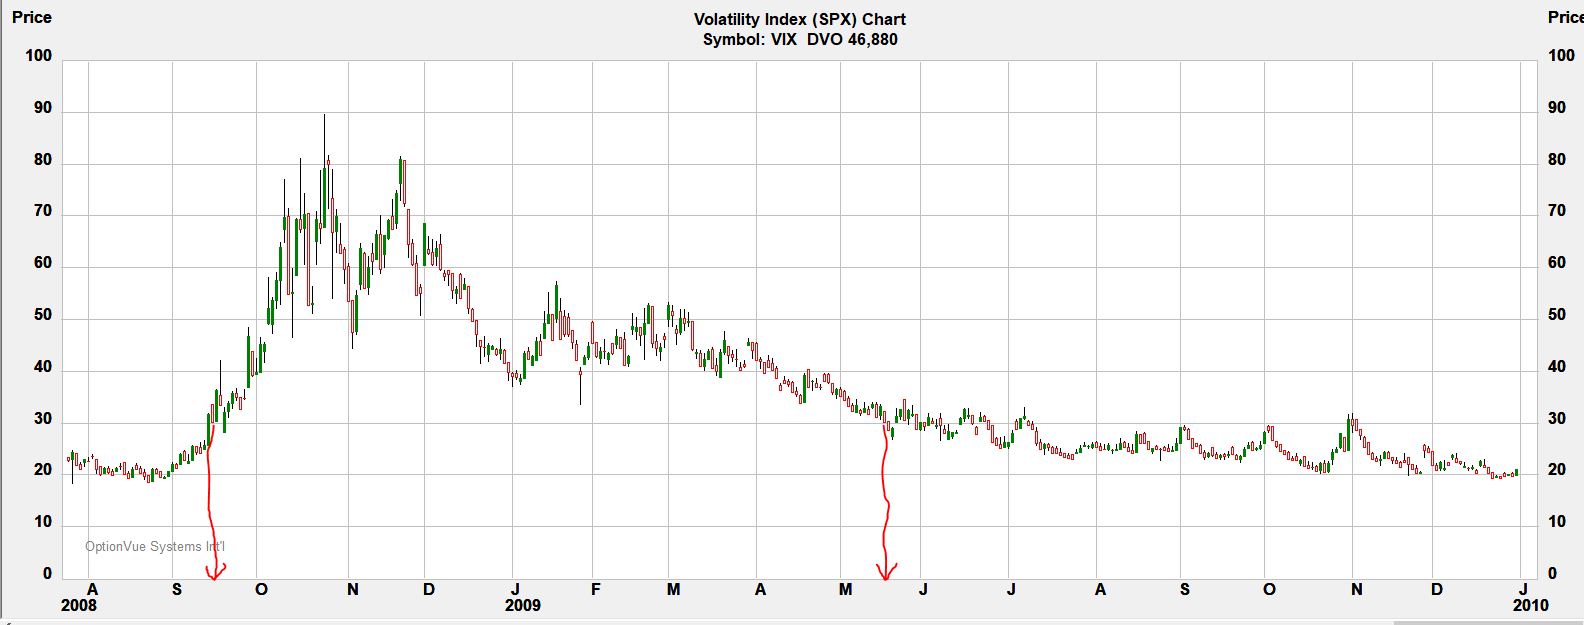
I have drawn (sorry, no straightedge available!) red arrows to the x-axis to bracket the high-volatility period. The period begins after the October (expiration) trade was placed. The November trade would be avoided. These are the two biggest losses in 2008. Which one corresponds to TT’s -2679?
I will continue the analysis next time.