2017 Performance Evaluation
Posted by Mark on August 31, 2018 at 06:50 | Last modified: September 4, 2018 11:53As I am a proponent of performance reporting, today I discuss my 2017 trading performance (also see here, here, and here).
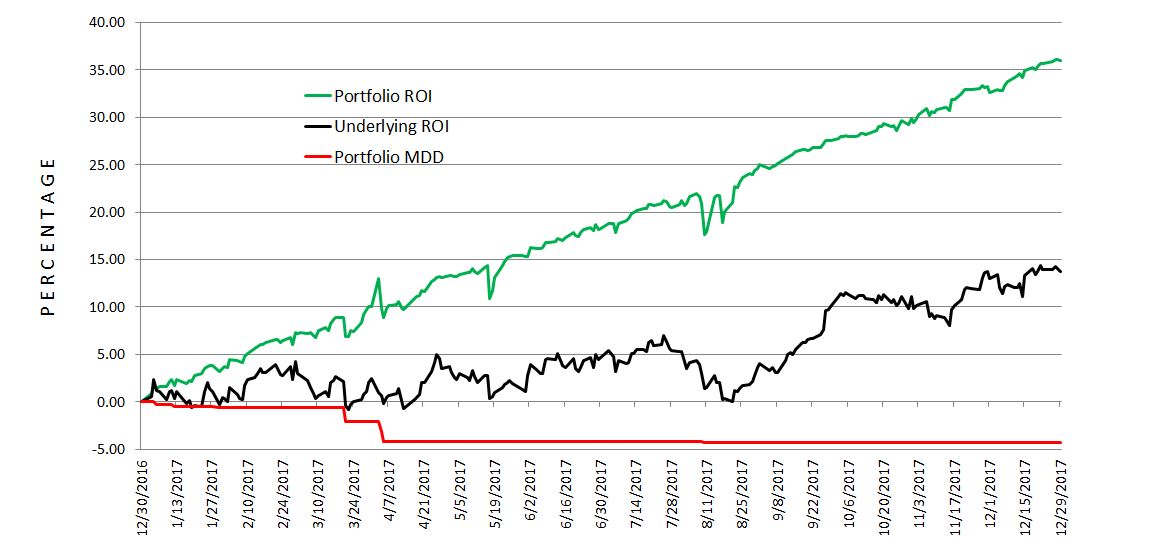
The green and black lines represent performance of my portfolio and the underlying, respectively. The latter is similar to a benchmark for comparison purposes without implementation of constant notional risk. MDD (red line) is maximum drawdown.
I generated +36% versus +14% for the underlying (dividend yield < 2% not included). My MDD was 4.3% versus 6.9% for the underlying, which gives me a risk-adjusted return (DD) 4.2x better. That is smashing. I also like to look at standard deviation (SD) of returns as a measure of risk. My portfolio posted a SD of 0.57, which is about 22% smaller than 0.73 for the underlying. This does not support my conclusion here, which I will soon update for a longer time frame. In the spirit of Sortino vs. Sharpe ratios, I looked at SD of negative returns (losing days) and found my portfolio with 0.60 to be 28% larger than 0.47 for the underlying.
I calculated a Sharpe-style (Sortino-style) ratio of 0.219 (0.208) for my portfolio versus 0.0738 (0.115). These calculations are based on daily returns rather than annualized but I think degree of outperformance is more important.
I also find it noteworthy that my portfolio had 83 losing days, which is ~26% fewer than 113 for the underlying.
Onward and upward, hopefully, for 2018!