Envestnet Case Study (Part 2)
Posted by Mark on August 28, 2018 at 06:38 | Last modified: January 26, 2018 12:57As my second TPAM to investigate, I began discussion of Envestnet before really scrutinizing their offerings. I now suspect them to be just another garden-variety, plain-vanilla IA that probably generates subpar returns and significant improvement.
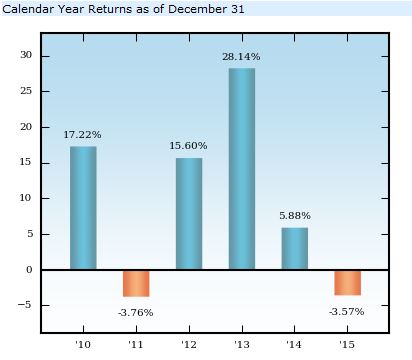
Even though the website content is “for investment professionals only” (a topic I thoroughly covered beginning here), after a bit of digging I was able to find a performance chart to assess my suspicion. Because the website appeared current when I looked at it in November 2017, I was somewhat perplexed as to why 2016 was not included. In any case:
For comparison:
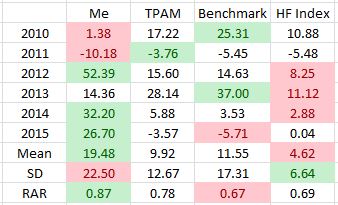
Green (red) shading is the best (worst) for each row. Risk-adjusted return (RAR) is average annual return divided by standard deviation (SD). Benchmark is a broad-based equity index. Hedge fund (HF) index is provided by Barclay Hedge.
My RAR beat Benchmark by 0.20, which makes me think that I performed well. I did realize a higher volatility of returns but this can sometimes be worthwhile if justified by net return. Consider that a 25% smaller position size would have lowered SD below Benchmark while still realizing a 3% better annualized return. This is why I calculate RAR.
The TPAM fared better (RAR) than Benchmark but worse than me. Cutting my position size by 45% would have lowered SD below the TPAM while still realizing a better annualized return by 0.79%. I find that surprisingly close. To look at RAR and say “0.87 vs. 0.78 is a 10% performance improvement” is misleading.*
As another angle of comparison, remember XC’s claim of outperformance by 25-50 basis points. My response was that any self-directed trader should aim to outperform by more than that. 79 is not much better than 50. I would rather see at least 150 to justify a management fee at least 1% higher. Of course, as discussed here, even a tiny management fee of 0.11% could make sense for me given ample assets to manage and no additional overhead.
Contrary to my initial suspicion, I do not think Envestnet’s showing is subpar nor, therefore, garden-variety either. It would seem that I have to be impressed with them. As another way of describing RAR [normalized for SD],* they outperformed the index by 136 basis points. Now that’s what I’m talking about! Kudos to Envestnet.
So far in my exploration of TPAMs, I have seen one good, one bad, and two that provide significant improvement.
I will continue to do more performance research to determine whether my numbers are in the ballpark of what financial institutions might be looking for in a TPAM.
With regard to my own performance, the above table has more to offer. I will discuss that next time.
* I need to re-evaluate this performance metric, which has been a favorite of mine. It might come down
to a comparison of percent difference, which is a multiplicative measure, and the additive difference of
annual outperformance.