Standard Deviation of Returns (Part 1)
Posted by Mark on December 11, 2017 at 07:12 | Last modified: September 10, 2017 15:03I have recently begun to trade a small friends-and-family account. In running the early numbers, I was surprised to see standard deviation (SD) of returns tracking higher for the portfolio than for the benchmark.
Based on my trading/research experience, naked puts (NP) generate comparable returns to the benchmark with a significantly lower SD of returns.
The best analysis I have between long shares and NPs may be the second graph shown here. In that analysis I did not calculate the total but using my naked eye and this online calculator, the NP portfolio returns 8.69% per year vs. 11.17% per year for the benchmark. That is not “comparable” returns—it’s a smackdown by the benchmark.
The graph does show this return comparison to be date sensitive. Just three months earlier (1.65% of the entire backtesting horizon), the NPs had a higher ROI than long shares. Across the whole graph, the NP line (red) beats long shares (blue) ~2/3 of the time. Statistically speaking, I worry about this inconsistency. Perhaps a rolling analysis should be done to get a larger sample size than just a single-point comparison, which may not be representative.
In the previous study I used maximum drawdown (MDD)—not SD of returns—as a measure of risk. When I looked at risk-adjusted return (RAR), the NP portfolio significantly outperformed despite the smackdown mentioned above.
Now let’s move forward and study the NP portfolio I have been trading for 1/6 year. I track the cumulative return for the portfolio and for the underlying index:
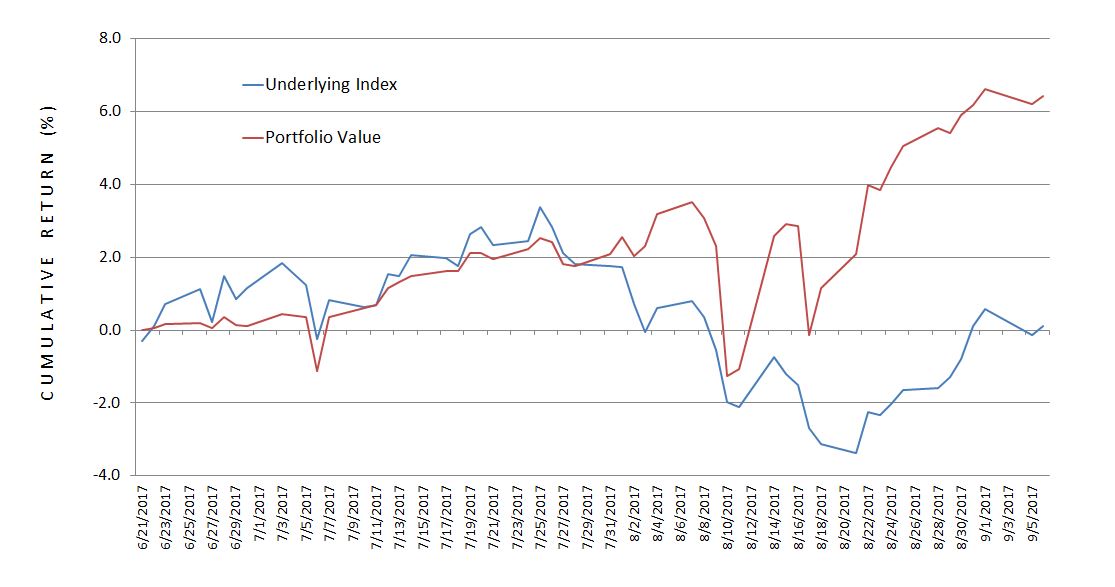
This is consistent with what I have come to expect from NPs. The equity curves are similarly shaped. The underlying index or NPs can outperform when the market is higher or lower, respectively.
I calculate daily % returns so I can monitor the SD of both:
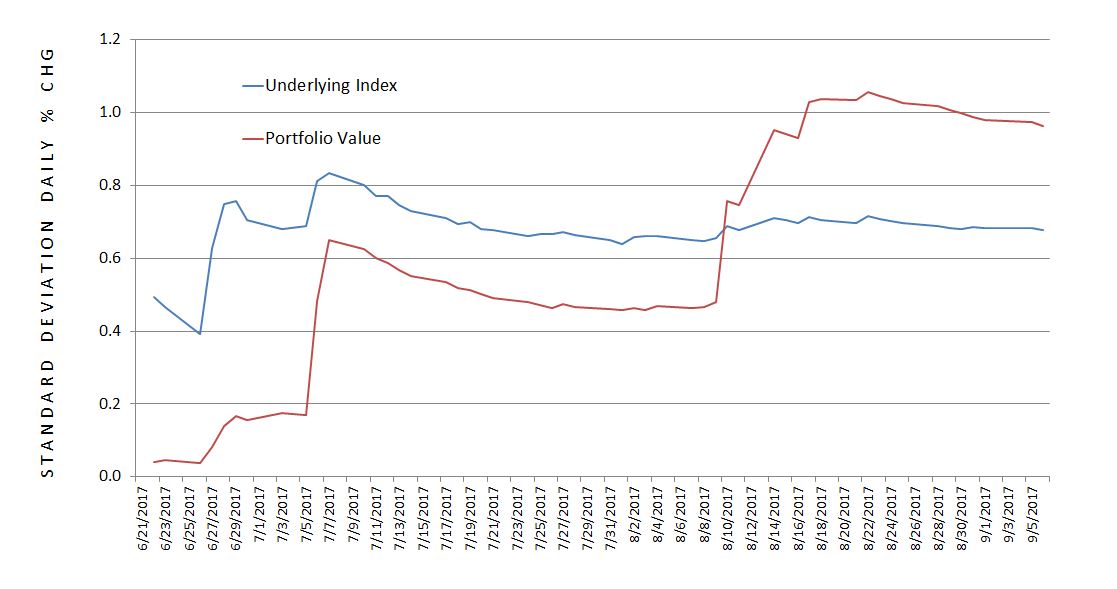
The NP portfolio shows a larger SD of returns than the benchmark! How can that be?
Categories: Money Management | Comments (1) | Permalink