Israelsen on Diversification (Part 2)
Posted by Mark on August 25, 2016 at 06:56 | Last modified: July 18, 2016 12:57Today I continue with some “words of wisdom” written by Craig Israelsen in the Feb 2016 issue of Financial Planning magazine.
> Interestingly, many investors claim to want a low-
> correlation portfolio that includes ingredients that
> do not all zig and zag at the same time. But when a
> few of their portfolio ingredients zag downward
> while other portfolio ingredients are zigging upward,
> the investor frets about the underperforming zaggers
> and becomes angry he owns a fund or stock that is
> losing money.
>
> Many investors talk the talk, saying that they want
> a low-correlation portfolio, but they can’t—or
> won’t—walk the walk and actually experience one.
As mentioned a couple times in the last post, I completely agree on an anecdotal level based on what I have heard from multiple investors during casual discussion.
Israelsen continued by providing data for different “levels of diversification” over the last 15 years. He looked at a 1-, 2-, 4-, 7-, and 12-asset portfolio. The 1-asset portfolio was 100% U.S. large-cap stocks. The 4-asset portfolio was 40% U.S. large cap, 20% U.S. small cap, 30% bonds, and 10% cash. The 12-asset portfolio was equally divided into 12 different asset classes. Annualized performance through 11/30/15:
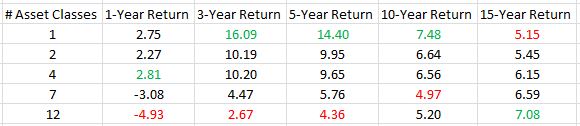
I highlighted the best (worst) performance for each column in green (red).
Israelsen writes:
> Over the three-year, five-year, and 10-year periods…
> the one-asset class investment… was the best
> performer. Finally, over the 15-year period, the
> value of a broadly diversified approach manifested
> itself with an annualized return of 7.08%…
If you’re a believer in diversification then this sounds like it took 15 years for the noise to shake out and the truth of diversified superiority to become evident.
However, from a statistical standpoint I doubt these numbers prove anything. The 12-asset portfolio performed worst over one, three, and five years. I believe one year is too short to conclude anything. 3-5 years, though? That’s at least intermediate-term. I would consider 10 years to be long-term and the 12-asset portfolio performed second worst over this interval. Given that it performed best over 15 years, I believe we have a set of performance numbers that, considered altogether, are inconclusive.
I also don’t think 15 years tells the whole story. I wonder what portfolio outperformed over 13, 14, 16, or 17 years? If it’s the 12-asset portfolio then Israelsen’s claims are substantiated. Based on the trend of numbers presented, though, I would not be surprised to see a more scattered distribution.
Israelsen writes:
> …a broadly diversified approach will lag behind
> when one particular asset class… is on a hot streak.
I don’t like this as a caveat for why the 12-asset portfolio lagged in all but the 15-year time interval. Some asset class is always going to be on a hot streak, which would suggest a broadly diversified approach will always lag. So if you want to choose a loser, make sure to diversify? That’s certainly what it can feel like and this feeds right back to the Israelsen excerpt at the top of this post.
Comments (1)
[…] I want to offer one further critique of Craig Israelsen’s performance data included in the last post. […]