2012 Performance Evaluation (Part 5)
Posted by Mark on February 15, 2013 at 06:13 | Last modified: February 8, 2013 06:32As my own boss, I am conducting an annual review in this series of blog posts. In http://www.optionfanatic.com/2013/02/14/2012-performance-evaluation-part-4/, I continued with evaluation of 2010 and 2011. I now want to spend some additional time focusing on 2011.
As mentioned, 2011 was the fourth time I had been forced to exit positions turned against me because of excessively large position sizing. In previous years, I escaped with relatively modest losses. In 2011, however, my maximum drawdown (MDD) exceeded 50%. That is entirely unacceptable when trading other people’s money, which is one reason why I don’t, but also unacceptable when trading my own. I’m running a business here and losing that much money is the fast track to going “belly up.”
2011 was the third consecutive year of underperformance relative to the major indices. Despite the ugly MDD, I managed a 42.5% rebound from the year’s low, which landed me down “only” 10.5% for the year. I’m probably still standing for this reason alone.
In an attempt to turn things around, I have attempted to implement two major changes. First, I have resolved to avoid trading until after 3:30 PM. On too many days, I got scared by seeing strong market moves in one direction early only to see those moves reverse by day’s end. Usually when I made a trade earlier in the day I was smacking myself at the close wondering why I wasn’t more patient. This is overtrading and it may be labeled as such only in retrospect.
To facilitate this end-of-day approach, on many trading days since summer 2011 I have not even looked at the market until 3:30 PM. Over the next 15 minutes I typically catch up with the market’s intraday movement and then place trades (if necessary) at 3:50 PM or later. This has helped me be less reactive to random noise responsible for so much market activity.
I will continue this analysis in my next post.
Categories: Accountability | Comments (1) | Permalink2012 Performance Evaluation (Part 4)
Posted by Mark on February 14, 2013 at 05:34 | Last modified: February 7, 2013 13:12In the last few posts, I have been conducting my 2012 annual review. In the future, this will take only a day or two. Since I have never blogged about it before, however, this time I am reviewing back to inception. I reviewed 2008 and 2009 in http://www.optionfanatic.com/2013/02/13/2012-performance-evaluation-part-3/. Today I will continue with 2010-11.
By the numbers, 2010 went like this:
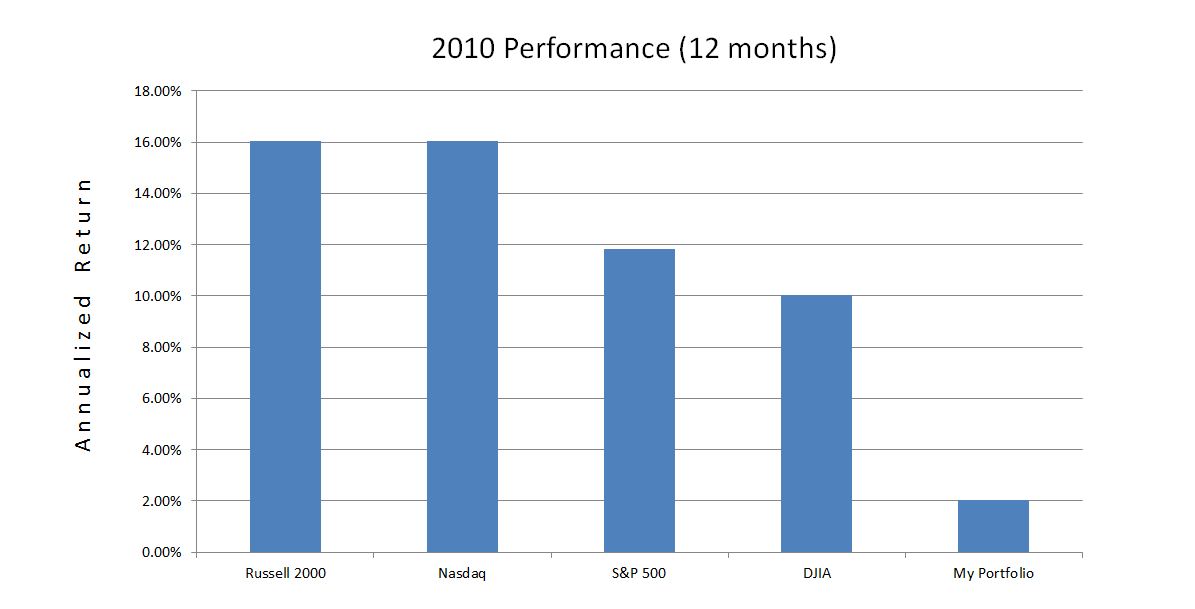
May 6, 2010, was the infamous Flash Crash where the DJIA dropped over 1000 points in one hour. May capped my MDD for the year of 20.5%. In the last post, I said this would be an acceptable annual MDD if it never got any worse. The largest MDD seen in the major indices for 2010 was 13.9% (Russell 2000), though. That makes my MDD seem a bit less heartening.
As market volatility soared from April to May of 2010, my portfolio hemorrhaged cash. The psychic pain became too much to bear on May 6, when I closed the last of my long positions. This may sound familiar because it is: a third time being caught trading too large. As is often the case when trading too large, I was forced out at the absolute worst time (MDD).
2011 was very similar to 2010:
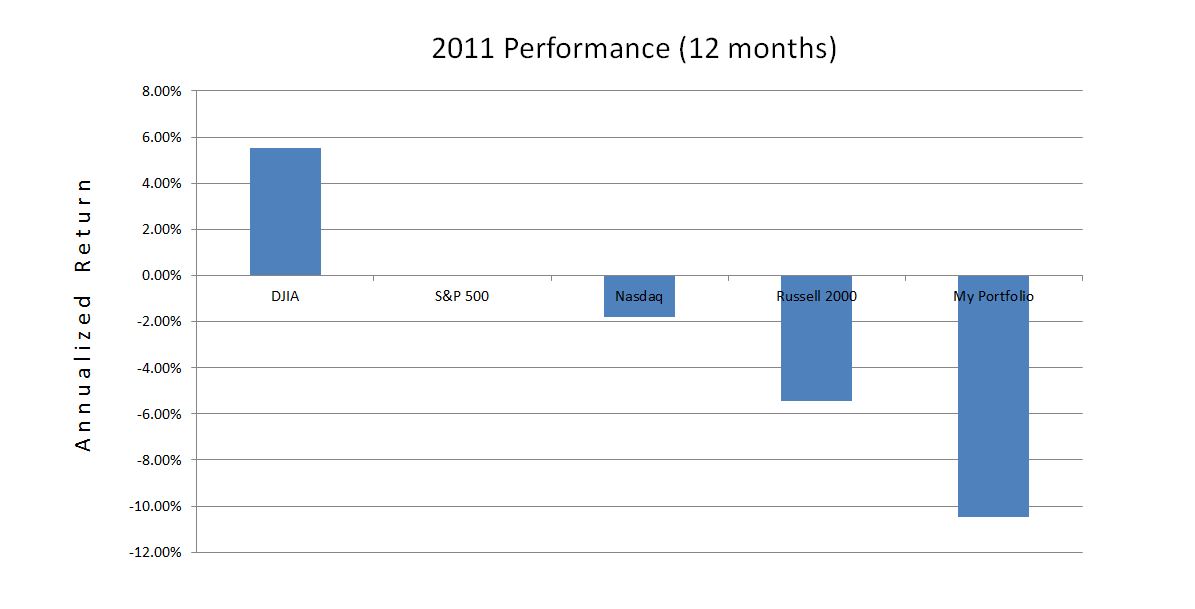
Again, this year brought a more severe mid-year market crash (Russell 2000 down 24.3% in 2011 vs. 17.1% in 2010 over roughly a 1-month time period), albeit without the magnitude of volatility increase seen during the Flash Crash (volatility spiked 65.2% in 2011 vs. 172% in 2010 over roughly a 1-month time period). I was camping at the time (with my laptop), and was caught with my pants down carrying too large a position for–what time is this? 2007, 2009, 2010… oh yeah, the FOURTH time. In prior posts, I have said that a 20% maximum drawdown (MDD) from one year to the next would be acceptable to me. In 2011, my MDD was 50.1%. Contrast this with the largest broad based index MDD of 25.6% and you have a recipe for disaster.
The analysis will continue with my next post.
Categories: Accountability | Comments (1) | Permalink2012 Performance Evaluation (Part 3)
Posted by Mark on February 13, 2013 at 04:30 | Last modified: February 7, 2013 05:24This blog series represents my 2012 annual review. In http://www.optionfanatic.com/2013/02/12/2012-performance-evaluation-part-2/, I discussed my performance through 2007.
2008 was my introduction to full-time trading. Faced with a market in correction, I traded much of the year with reduced position size:
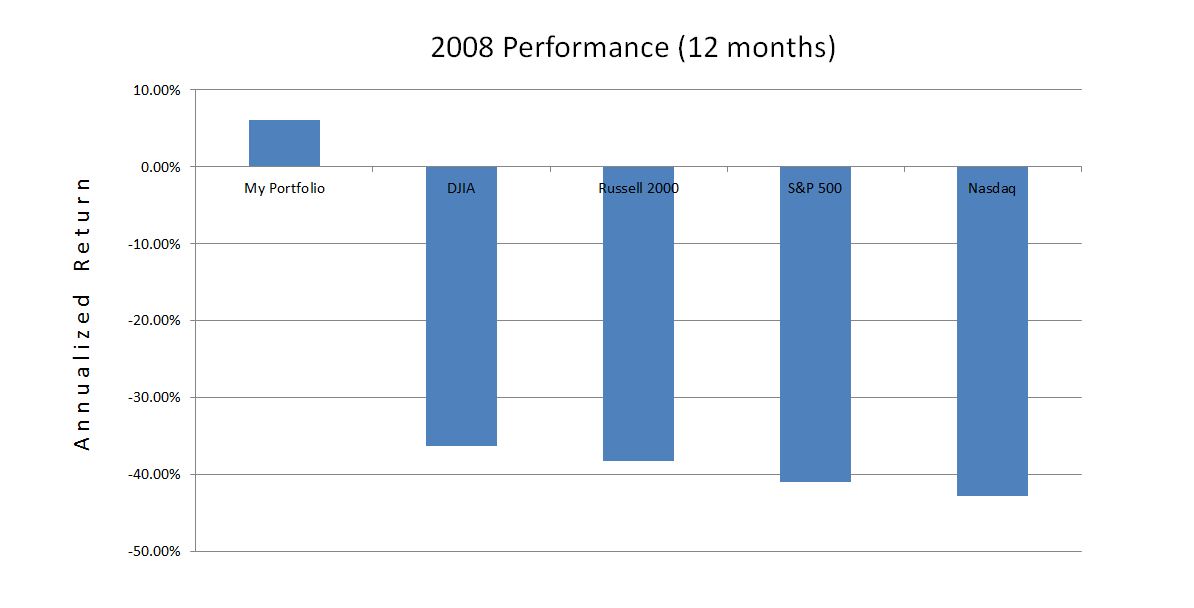
This was not a cakewalk as my maximum drawdown (MDD) hit 20.9% in March. While discomforting, if this were the worst MDD ever encountered on a year-to-year basis then I would be content.
My MDD was only about half that seen in the major indices. I capitalized on much of the October-November tumble by purchasing put spreads. I remember spending hours in front of the screen with my mouth propped open as I watched the horror of a market in free fall. I felt bad for those who could only watch big retirement savings fly out the window from one day to the next because “buy and hold” was the mantra espoused by the financial industry for years and years.
My good fortune reversed in 2009:
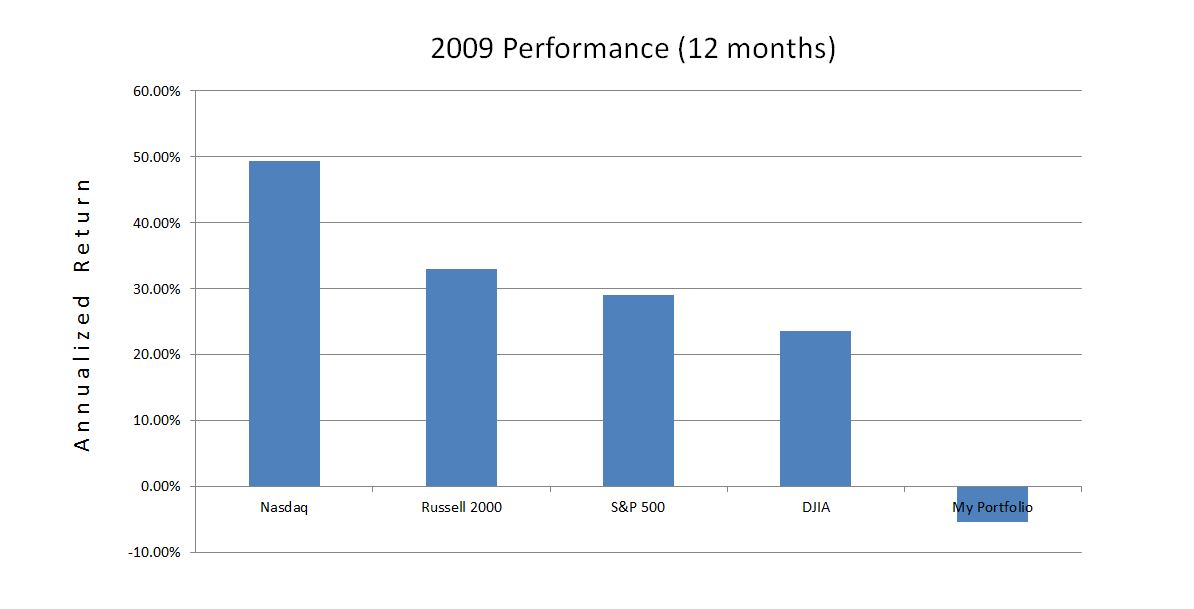
What killed me in 2009 was a 27.7% MDD, which occurred in the span of two months. This was another case of trading too large and being caught with my pants down when the market made its third and final thrust lower. I traded small for the remainder of the year as I reassessed my trading plan.
In retrospect, what frustrates me is the need to experience this lesson multiple times before I learn it. My first lesson was in 2007 when a couple sharp selloffs turned my huge, long positions against me. In 2009, I saw this happen once again.
I will continue the analysis in my next post.
Categories: Accountability | Comments (1) | Permalink2012 Performance Evaluation (Part 2)
Posted by Mark on February 12, 2013 at 06:50 | Last modified: February 6, 2013 16:25In the absence of co-workers and a boss, the biggest reason I maintain this blog is to keep myself accountable. To that end, I presented equity curves of my performance since inception (2001) in http://www.optionfanatic.com/2013/02/11/2012-performance-evaluation-part-1/. The current blog series represents my annual performance review and a tool to tweak my trading plan, if necessary, to stay on track with long-term goals.
Because my time commitment and overall approach have been highly variable over the last 11+ years, I will not try to make generalizations about the whole. This would be like comparing apples to oranges.
From June 2001 through the end of 2006, I worked full-time in pharmacy. My investment plan included a set of stock screens that I ran on a monthly basis. My net return during these years is shown below:
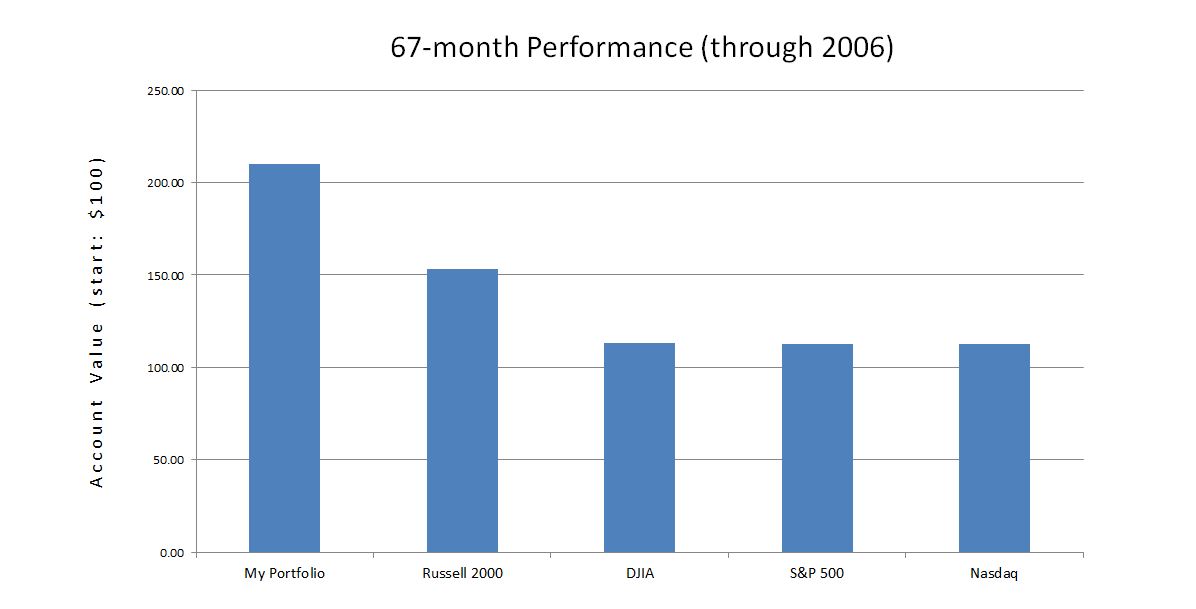
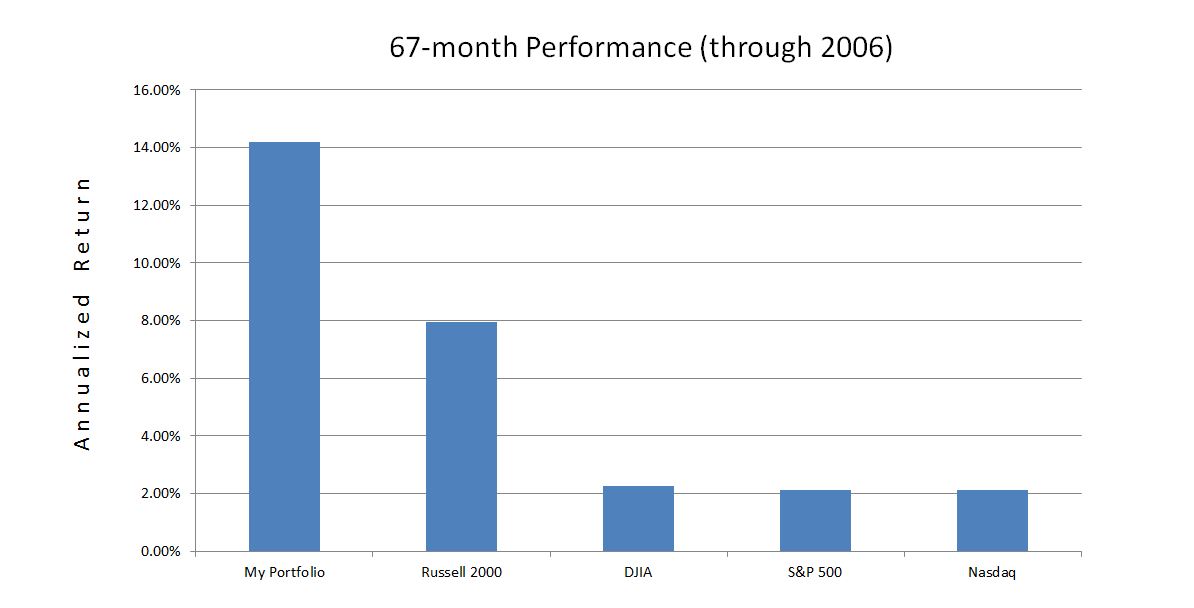
These years included sharp selloffs during 9/11 (2001) and 2002 along with bull market conditions in 2003 and 2004-2006. The maximum drawdown, faced only five months into my investing career, was 32%: larger than that seen by the Russell 2000 and DJIA indices. In the end, I did manage to outperform the Russell 2000 by 6.2% per year and the other three indices by about 12% annually.
In 2007, I started trading options in earnest. I was up 36% for the first five months of the year vs. the leading index (Russell 2000), which was up only 6%. By year’s end, I gave back all these profits and more. In the process, I learned an important lesson about luck. Because good luck may sour, being in a position to limit losses when the market turns against me is more important than being able to make money when the market goes my way. This is good risk management that is essential for success because the degree of loss will usually outpace the degree of gain when all other factors remain equal.
I will continue this analysis in my next post.
Categories: Accountability | Comments (1) | Permalink2012 Performance Evaluation (Part 1)
Posted by Mark on February 11, 2013 at 09:44 | Last modified: February 4, 2013 12:31The main reason I maintain this web site is to keep myself on task with what I want to do. Starting from the “ground up,” system development has been very difficult for me. Without co-workers, it would be easy to give it up and do something else. The web site keeps me accountable.
Along these lines, I want to spend some time focusing on performance to make sure I remain on course in pursuit of personal goals. Getting focused on small details and losing sight of the big picture is very easy to do when you don’t have to check in with bosses and supervisors. I will report here.
As a brief review, I took over the investing for my personal account in mid-2001. In 2008 I resigned from Pharmacy and began life as a full-time trader. My investing/trading approach has changed much over the years and that is important for the here-and-now. With the performance statistics now updated through January 2013, though, I wish to first spend some time looking at the entire history.
Below is a graph of my total performance to date. I have set the starting account value to be $100. The first graph is plotted with linear scaling:
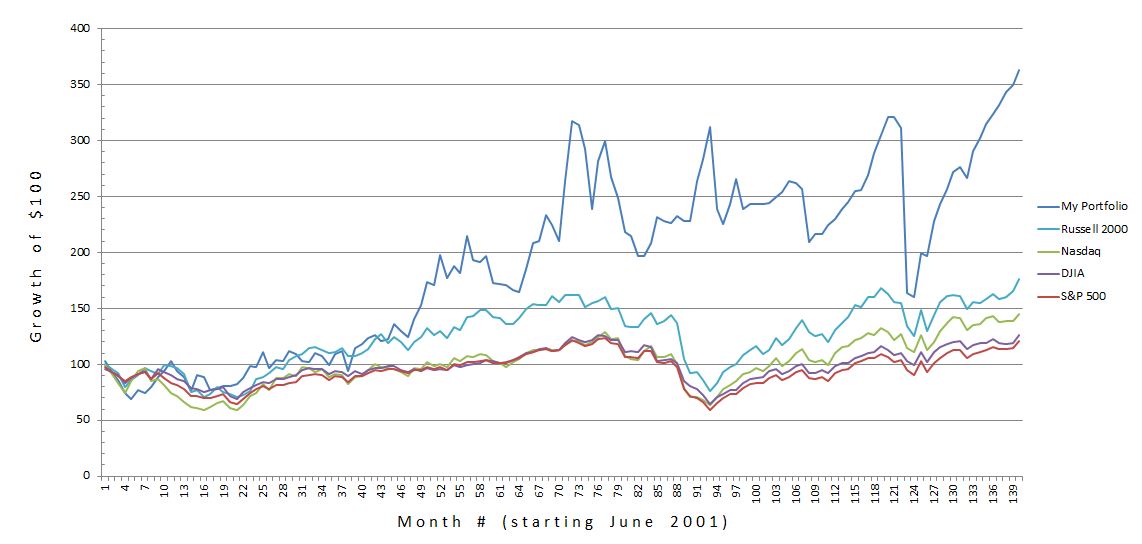
Since linear scaling can sometimes be misleading, below I show the same data with logarithmic scaling. Note here that identical percent changes traverse the same distance along the y-axis:
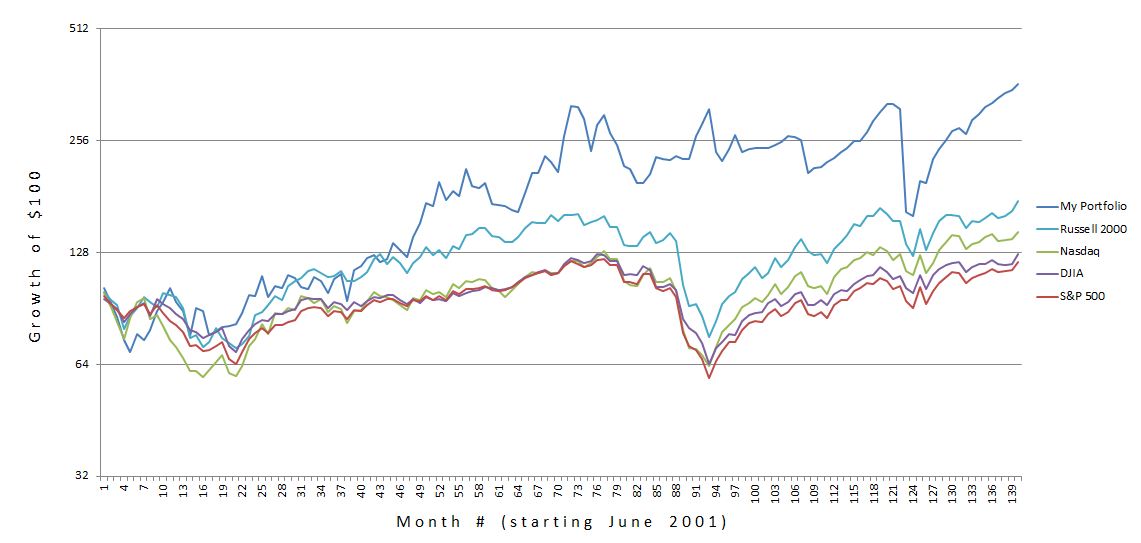
In my next post, I will begin to analyze and to discuss these data.
Categories: Accountability | Comments (3) | PermalinkWalking it Forward with System Validation (Part 6)
Posted by Mark on February 8, 2013 at 02:22 | Last modified: February 1, 2013 03:01My blog series “Lingering Quandaries about System Development” concluded by discussing a paradox with regard to Howard Bandy’s WFA discussion. In http://www.optionfanatic.com/2013/02/07/lingering-quandaries-about-system-development-part-9/, I concluded by suggesting a new and improved WFA that can achieve system development goals.
I recommend not following Bandy’s advice to select periods for IS and OOS data early in the process and retaining them throughout development. Besides effectively burying your head in the sand as described by Example 1 (http://www.optionfanatic.com/2013/01/29/walking-it-forward-with-system-validation-part-1/), you really can’t know what values may or may not work until you actually perform the WFA. Validation is the final step of system development.
Rather, look to perform WFA by optimizing the periods and studying the entire parameter space. Perhaps I will vary IS period from one year to three years by increments of two months. Perhaps I will vary OOS period from one month to six months by increments of one month. I then need to plot values of the subjective function in a three-dimensional space (or in two dimensions with color coding to represent subjective function ranges) to get a feel for where the high plateaus exist. I should then select the time ratio to coincide with the middle of a high plateau and use trading parameters coincident with that combination.
Every time I do a WF iteration, I am selecting WF parameter values and subsequently trading parameter values. The two differ, in effect, by an order of differentiation. That is, the subjective function for the WF optimization coincides with a value for the concatenated equity curve to date. The subjective function for the iteration coincides with a value for the equity curve of the preceding IS period only.
WFA serves to both validate a trading system and to direct trading at the right edge of a chart.
Categories: System Development | Comments (0) | PermalinkLingering Quandaries about System Development (Part 9)
Posted by Mark on February 7, 2013 at 07:54 | Last modified: February 1, 2013 02:36http://www.optionfanatic.com/2013/02/06/lingering-quandaries-about-system-development-part-8/ continued discussion of a third System Development paradox that I have been trying to sort through: Howard Bandy’s handling of WFA. Bandy said to choose periods for IS and OOS data early in the process and then stick with them throughout development.
The more you vary these system parameters, Bandy said, the more the OOS data loses its “out-of-sampleness,” which is why they ought not to be changed. I flat-out disagree with this statement. Varying the time ratio does not change or determine parameter values involved with the trading rules. Varying the time ratio is solely to verify that neighboring values also validate the system. This will remove suspicion of system validation as a fluke occurrence.
One issue that remains unresolved for me is how to conceptualize “varying the time ratios” in a systematic manner that may be plotted. I consider myself spatially challenged so I probably just need to cram into my brain the need to specify a minimum and maximum value for both IS and OOS periods and an increment by which to vary them. I can then make a two-dimensional plot of the subjective function (e.g. RAR/MDD) and perhaps color code the values. This way, I can see if an area of outperformance stands out.
One other issue I wonder about is whether OOS period might be limited by sample size considerations. The OOS period will already be short relative to the IS period. Might I need to be concerned about it being short enough to allow for any trades? The shorter the period, the more total periods I will have in the WFA but if it is too small to allow for trades in any one iteration then I wonder if the entire WFA risks insufficiency.
I will only discover the answer to this question when I start attempting WFA myself.
In my next post, I will summarize the new-and-improved approach to WFA.
Categories: System Development | Comments (1) | PermalinkLingering Quandaries about System Development (Part 8)
Posted by Mark on February 6, 2013 at 05:05 | Last modified: January 31, 2013 13:59In http://www.optionfanatic.com/2013/02/05/lingering-quandaries-about-system-development-part-7/, I introduced the third paradox encountered thus far in my System Development studies–this one having to do with walk-forward analysis (WFA).
As I suggested, something about the validation process Howard Bandy describes seems like curve fitting. A few months ago, a reader asked Bandy in a forum post about the proper time ratio of IS:OOS data to be used in WFA. Bandy did affirm that some time ratios may produce acceptable OOS performance where others may not. His solution was to use whatever works. To me, that sounds like cherry picking the right combination, which is “curve fitting:” the four-letter word of System Development.
Just the other day, I once again directed this question to Bandy on his blog. His response:
> Yes, in-sample and out-of-sample time periods are parameters of the system and they do need to
> be chosen. My recommendation is to choose them (particularly the length of the in-sample period)
> early in the development process, then keep them fixed from that point on… Keep in mind that
> every decision to adjust any component of a system based on examination of out-of-sample results
> reduces the out-of-sampleness of that data and increases the degree that the system is curve-fit to
> the specific data.
As a parameter of the system itself, choosing set values for IS and OOS periods is like Example 1 from http://www.optionfanatic.com/2013/01/29/walking-it-forward-with-system-validation-part-1/. This fails to take into account the shape of the parameter space. I want to see high plateaus of performance rather than peaks. In taking Bandy’s suggestion, I would never study the neighboring values.
I will conclude this discussion in the next post.
Categories: System Development | Comments (1) | PermalinkLingering Quandaries about System Development (Part 7)
Posted by Mark on February 5, 2013 at 04:26 | Last modified: January 30, 2013 05:47I left off this series in http://www.optionfanatic.com/2013/01/28/lingering-quandaries-about-system-development-part-6/ talking about paradoxical views on robustness. This along with a subjective function paradox described in http://www.optionfanatic.com/2013/01/18/lingering-quandries-about-system-development-part-1/ have stunted my progress in making sense of System Development. Today I will introduce a third paradox within my understanding having to do with walk-forward analysis (WFA).
I finally added WFA, or validation, to this blog in a series of posts ending with http://www.optionfanatic.com/2013/02/04/walking-it-forward-with-system-validation-part-5/. In that fourth example, I used two years of IS data followed by one year of OOS data. This was based on:
> Assuming that I can test and optimize the trading system on as little as two years of data… [1]
What does this actually mean?
I can optimize and test the trading system on an infinite number of time ratios. A few examples include: three years IS to six months OOS, 30 months IS to nine months OOS, 18 months IS to three months OOS, etc. What I am most interested in is the overall equity curve formed by piecing together (also known as concatenating) the results of each OOS testing. Total number of trades could be a limiting factor because as the OOS time interval decreases, fewer trades may be generated. If the concatenated equity curve does not have at least 50-60 trades then I am likely to consider it fluke and less meaningful.
Sample size concerns aside, what seems logical is that some time ratios will generate acceptable concatenated equity curves and others will not. Perhaps [1] should be rewritten:
> Assuming the specified time ratio generates solid OOS performance…
This, however, is circular reasoning because it suggests choosing the time ratio based on whether the concatenated equity curve is good. A main reason to employ WFA in the first place is to validate whether the concatenated equity curve will be good.
Put another way, this reeks of curve-fitting WFA–the very tool being used to prevent curve-fitting!
Let’s sleep on this, shall we?
Categories: System Development | Comments (1) | PermalinkWalking it Forward with System Validation (Part 5)
Posted by Mark on February 4, 2013 at 05:03 | Last modified: January 30, 2013 04:46In http://www.optionfanatic.com/2013/02/01/walking-it-forward-with-system-validation-part-4/, I introduced the process of Walk-Forward Analysis (WFA).
The pictorial representation of the WFA process for Example #4 is as follows:
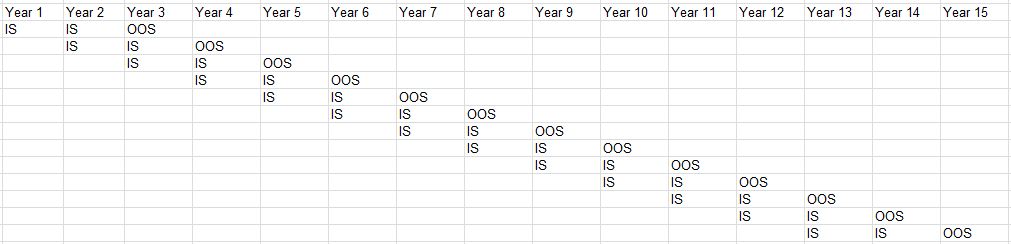
Note how WFA achieves 13 full years of OOS testing and validation.
Howard Bandy considers WFA to be the gold standard of trading system validation, and I see multiple reasons to support his claim. First, the largest risk for curve-fitting has been eliminated by using OOS data to test a system developed using IS data. To find the best combination of trading parameters and then to advertise said system to potential customers is unrealistic at best and criminal at worst. Second, with WFA my system will better adapt to changes in market behavior over time. Change in market behavior is responsible for systems working well until they don’t. WFA provides the means to adapt. Provided my OOS data is extensive enough to sample all market environments, a WFA equity curve sufficient to meet my personal criteria (i.e. subjective function) should give me the confidence necessary to trade the system live. WFA is not just a nifty backtesting tool; it offers a process that may be done at any time to resync trading parameters with recent market activity.
In this blog series, I have studied four general approaches to system development. In Example #1, I backtested one set of system parameters to trade live if results impressed. In Example #2, I optimized a trading system over historical data to subsequently trade live. In Example #3, I optimized a trading system over 13 of 15 years of historical data and used the last two years to validate the system. In Example #4, I used WFA to generate 13 full years of OOS validation on a trading system that periodically aligns itself to recent market activity.
Because the system parameters may adapt, WFA results in a dynamic trading system that is qualitatively different from what most people conceptualize when discussing system development.
This writer believes it makes a lot of sense.
Categories: System Development | Comments (0) | Permalink