Stop at the Equity Curve (20) (Part 3)
Posted by Mark on July 14, 2016 at 06:20 | Last modified: May 16, 2016 15:55The end-of-trade PnL equity curve filter looked promising but mark-to-market (MTM) is what I would encounter in real-time.
To do this, I replicated a previous backtest from 5/1/2008 through 3/16/2009 and tracked daily account value. The 239 days between 6/17/2008 and 2/4/2009 was the shortest elapsed time to get four exit signals.
I expected the MTM equity curve to largely parallel the equity curve generated previously. I expected some evidence of future shift since the end-of-trade PnL (spreadsheet) approach counts the final trade PnL on the date of trade inception:
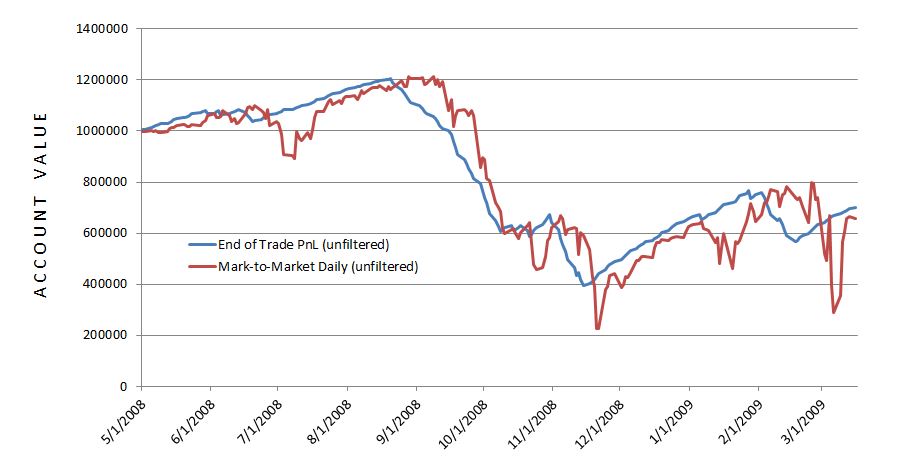
The future shift is evident along with much more volatility in the MTM daily curve. With regard to filter efficacy:
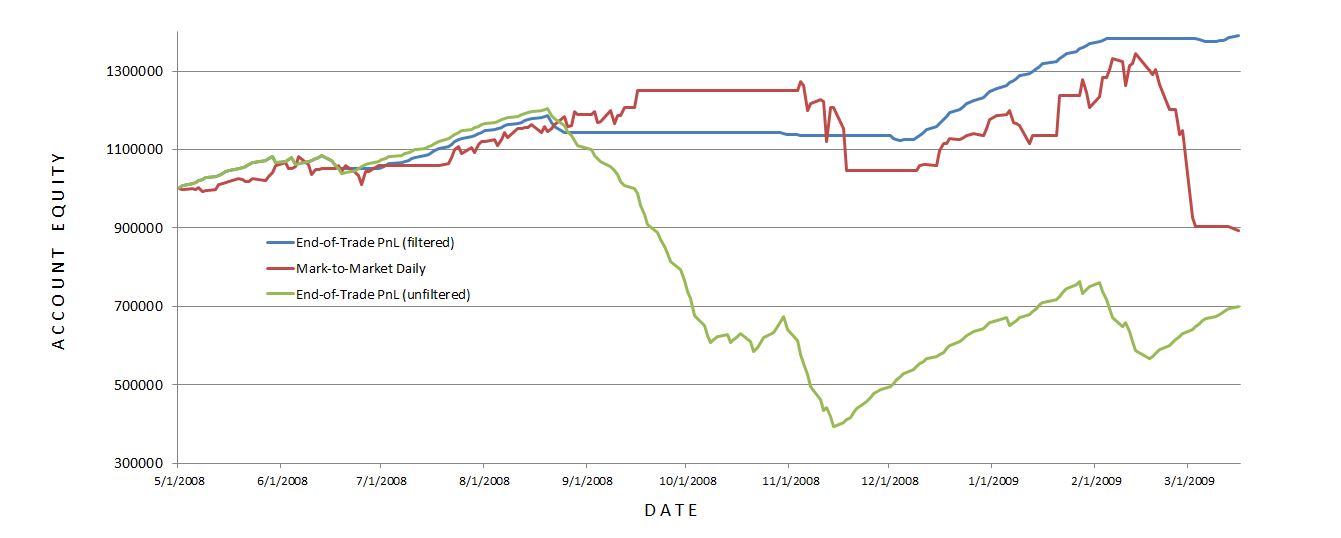
I was disappointed with MTM daily’s performance with the 20-SMA trade filter. It worked well until Feb 2009 when it suffered a very large drawdown (DD). This was the maximum DD seen with the MTM daily equity filter and a larger DD than seen without! This suggests winning (losing) days were (not) filtered out: a dangerous combination.
A closer look at the data shows the MTM daily equity filter was more active than the end-of-trade PnL filter. The former (latter) generated 13 (4) signals. Of the 13 signals, five or two lasted one or two days, respectively. This suggests a large number of whipsaws because such a filter will be effective by signalling a big market decline to remain on the sidelines for an extended period. The MTM filter was particularly ineffective in March 2009 as the strategy in the market on March 2 to lose $220K and out of the market on March 4 to miss a $175K gain.
The graph shows the MTM equity curve filter did about $200K better than no filter at all. However, with all the whipsaws I am not convinced it is any more effective. I would need a longer MTM backtest to be convinced.
Backtesting made it clear why the MTM daily filter was so much more volatile. The end-of-trade PnL method only gains or loses the value of one trade per day. Although this is big money for the largest losers, on big down days the MTM daily filter method loses big money on all of the open trades.
While the end-of-trade PnL filter was quite effective, as I suspected it is very artificial and looks nothing like the MTM daily filtered equity. If I want to continue studying an equity curve approach then I should backtest over a longer period. Alternatively, I could look to price action of the underlying for DD minimization.
Categories: Backtesting | Comments (0) | PermalinkStop at the Equity Curve (20) (Part 2)
Posted by Mark on July 11, 2016 at 07:27 | Last modified: May 13, 2016 17:21Consider this a manuscript in reverse. Having detailed the problems and limitations last time, today I will present the eye-popping, artificial results.
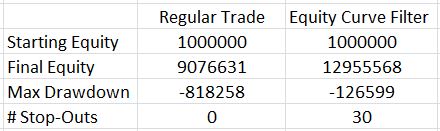
Here are the total return and drawdown numbers:
Here are the overall system statistics:
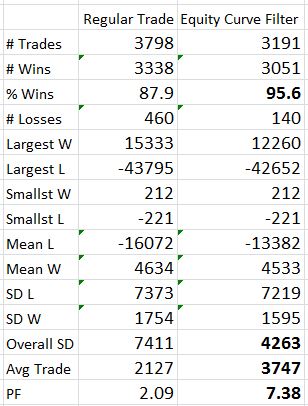
The filter clearly did a good job of removing losing trades. I highlighted the numbers that really tell the difference. The filter removed 607 trades but the % wins increased from 88% to over 95%, the overall standard deviation was reduced by 42%, and the average trade was 76% higher!
The Profit Factor went from solid to a ridiculous 7.38. This number is high enough to be worrisome. Aside from the caveats I mentioned last time, no slippage was factored into the stops so I know performance would not be this good.
The next step is to backtest several months and mark-to-market daily. I can even make sure to input the same trades as used last time. I want to see how the shape of the equity curve compares and see if significant differences exist between drawdowns.
If that ends up similar then the next step will be to study long puts. With the MA undercut 30 times, I have many instances to study in order to see how a delta-neutral position fares.
Once that’s done, I need to investigate the parameter space for MA period.
Categories: Backtesting | Comments (1) | PermalinkStop at the Equity Curve (20) (Part 1)
Posted by Mark on July 7, 2016 at 06:26 | Last modified: May 13, 2016 17:10What happens when the equity curve is used as an indicator to be in or out?
To study this, I used my -0.10/3x spreadsheet with 3,798 trades. As an arbitrary starting point, I used a 20-SMA (current day included) to be calculated after the close. When necessary, I waited one whole trading day to take action.
What’s particular about this approach is the methodology by which I have simplified the equity calculations but logistics must be considered when transitioning to real-time application. The final gain/loss registered at trade close is added to the account at trade inception. This creates the appearance of more continuity in the spreadsheet than might actually be experienced.
Consider a big down day that pushes multiple trades to maximum loss. The spreadsheet shows the total equity and MA after each trade is tabulated but in reality they would all be closed at once. This could significantly reduce the efficacy of the risk-management tool. From a mark-to-market perspective, it is conceivable that cumulative losses on many trades might drive equity below its moving average before any single trade actually closes for max loss. I’m afraid the only way to compare the two would be to backtest again and track daily equity in this manner. Hopefully it will become clear after a small sample.
When I traded naked strangles, I anecdotally noted great potential savings were I to have exited positions after incurring the greatest daily loss over the last several weeks and staying out of the market entirely until I saw a weekly equity gain. This makes me think there might be something useful about monitoring EOD equity vs. the moving average but I also wonder if this might be accompanied by more whipsaws.
Aside from timing issues, another issue requiring careful consideration is the position neutralization itself. Slippage would be horrific if I tried to close an inventory of legs especially if I had to replace them a few days later. I might be better off creating a delta-neutral position by purchasing NTM options and holding until the equity curve crosses above once again.
Having said all this, I’ll run through the results in my next post.
Categories: Backtesting | Comments (1) | PermalinkThe Pseudoscience of Trading System Development (Part 5)
Posted by Mark on June 28, 2016 at 07:48 | Last modified: May 10, 2016 12:29My last critique for Perry Kaufman’s system is its excessive complexity.
I believe the parameter space must be explored for each and every system parameter. For this reason, I disagree with Kaufman’s claim of a robust trading system. He applied one parameter set to multiple markets but I don’t believe successful backtesting on multiple markets is any substitute for studying the parameter space to make sure it’s not fluke. Besides, I don’t care if it works on multiple markets as long as it works on the market I want to trade.
When exploring each parameter space, the analysis can quickly get very complicated. I discussed this in a 2012 blog post. In Evaluation and Optimization of Trading Strategies (2008), Robert Pardo wrote:
> Once optimization space exceeds two dimensions
> (indicators), the examination of results ranges
> from difficult to impossible.
To understand this, refer back to the graphic I pasted in Part 2. That is a three-dimensional graph with the subjective function occupying one dimension.
For a three-parameter system, I can barely begin to imagine a four-dimensional graph. The best I can do is to imagine a three dimensional graph moving through time. I’m not sure how I would evaluate that for “spike” or “plateau” regions, though: terms that refer to two dimensional drawings.
For a better visualization of what I’m trying to say here, this video shines light on Pardo’s words “difficult to impossible” (and if you can help me spatially understand the video then please e-mail).
Oh by the way, Kaufman’s system has seven parameters, which would require an eight-dimensional graph.
At the risk of repetition, I will say once again that Kaufman is not wrong. Just because it doesn’t work for me does not mean it is wrong for him.
And that is why I have pseudoscience in the title of this blog series. That is also why I use the term subjective instead of objective function. A true science would be right for everyone. Clearly this is not. It’s wrong for me and it should be wrong for you but it is never wrong for the individual or group who does the hard work to come up with and develop it.
Categories: System Development | Comments (1) | PermalinkThe Pseudoscience of Trading System Development (Part 4)
Posted by Mark on June 23, 2016 at 06:51 | Last modified: May 8, 2016 10:42Today I want to continue through my e-mail correspondence with Perry Kaufman about his April article in Modern Trader.
Kaufman e-mailed:
> are not particularly sensitive to changes
> between 90 and 100 threshold levels, so I
> pick 95… Had it done well at 95 and badly
> at 90, I would have junked the program.
Junking the system and not writing an article on it would be the responsible thing to do. He can claim to be that person of upright morals but it doesn’t mean I should trade his system without doing the complete validation myself. I’m quite sure that even he would agree with this.
In response to my comments, Kaufman sent a final e-mail:
> I appreciate your tenacity in pursuing this…
> I’m simply providing what I think is the basic
> structure for something valuable. I had no
> intention of proving its validity scientifically…
> I’m interested in the ideas and I will then
> always validate them before using them. For
> me, the ideas are worth everything.
Kaufman essentially absolves himself of any responsibility here. He did nothing wrong in the article but I, as a reader, would be wrong to interpret it as anything more than a collection of ideas. It may look like a robust trading system but I have much work to do if I am to validate it and adopt it as my own.
What can give me the confidence required to stick with a trading system is the hard work summarized by the article but not the article itself. If the sweat labor is not mine then I am more likely to close up shop and lock in maximum losses when the market turns against me because paranoia, doubt, and worry will come home to roost. When I do the hard work myself (or with a team of others to proof my work) then I have a deeper understanding of context and limitations, which is what gives me the confidence necessary to stick with system guidelines.
If this sounds anything like discretionary trading then it should because I have written about both in the same context. It’s also the same reason why I recommend complete avoidance of black box trading systems.
Categories: System Development | Comments (0) | PermalinkThe Pseudoscience of Trading System Development (Part 3)
Posted by Mark on June 20, 2016 at 06:36 | Last modified: February 9, 2017 09:57I left off explaining how Perry Kaufman did not select the parameter set at random for his April article in Modern Trader. This may be okay for him but it should never be okay for anyone else.
The primary objective of trading system development is to give each of us the confidence required to stick with the system we are trading. I could never trade Kaufman’s system because I find the article to be incomplete.
In an e-mail exchange, Kaufman wrote:
> Much of this still comes down to experience and
> in some ways that experience lets me pull values
> for various parameters that work. Even I can say
> that’s a form of overfitting.
Kaufman’s personal experience is acceptable license for him to take shortcuts. He admits this may be overfitting [to others] but he doesn’t want to “reinvent the wheel.”
> But the dynamics of how some parameters work
> with others, and with results, is well-known.
Appealing to my own common sense and what is conventional wisdom, Kaufman is now saying that I don’t need to reinvent the wheel either. I disagree because I don’t have nearly enough system development experience to take any shortcuts.
> My goal is to have enough trades to be
> statistically significant (if possible),
> so I’m going to discard the thresholds
> that are far away.
I love Kaufman’s reference to inferential statistics. I think the trading enterprise needs more of this.
> Also, my experience is that momentum indicators…
Another appeal to his personal experience reminds me that while this may be good enough for him as one trading his own system, it should never be good enough for others. I feel strongly that when it comes to finance, the moment I decide to take someone’s word for it is the moment they will have a bridge to sell me that doesn’t belong to them in the first place.
Money invokes fear and greed: two of the strongest emotions/sins in all of human nature. They are strong motivators that provide strong temptation. I did a whole mini-series on fraud and while I’m not accusing Kaufman of any wrongdoing whatsoever, each of us has a responsibility to watch our own backs.
I will continue next time.
Categories: System Development | Comments (1) | PermalinkRandomization: Not the Silver Bullet
Posted by Mark on June 17, 2016 at 06:36 | Last modified: May 29, 2021 08:53Random samples are often a research requirement but I believe trading system development requires something more.
Deborah J. Rumsey, author of Statistics for Dummies (2011), writes:
> How do you select a statistical sample in a way
> that avoids bias? The key word is random. A
> random sample is a sample selected by equal
> opportunity; that is, every possible sample of
> the same size as yours had an equal chance to
> be selected from the population. What random
> really means is that no subset of the
> population is favored in or excluded from the
> selection process.
>
> Non-random (in other words bad) samples are
> samples that were selected in such a way that
> some type of favoritism and/or automatic
> exclusion of a part of the population was
> involved, whether intentional or not.
Randomized controlled trials have been said to be the “gold standard” in biomedical research but I do not believe randomization is good enough for trading system development. Yes it would be good to avoid selection bias but this is not sufficient. I wrote about this here. The only way I can know my results are not fluke is to optimize and test the surrounding parameter space. Evaluating the surface will reveal whether a random parameter set corresponds to a spike peak or the middle of a plateau.
This perspective on randomization concurs with my last post. Perry Kaufman selected one and only one parameter set to test and for that reason I took him to task.
As Rumsey’s quote suggests, statistical bias is never a good thing. E-mail correspondence suggests Kaufman did not pick any of the values in his particular parameter set at random. He selected them based on his experience and knowledge of market tendencies. My gut response to this is “just do the work and test them all.”
While this may or may not be feasible depending on how multivariate the system, it brings to light the main objective of trading system development. I will discuss this next time.
Categories: System Development | Comments (0) | PermalinkThe Pseudoscience of Trading System Development (Part 2)
Posted by Mark on June 14, 2016 at 06:15 | Last modified: May 4, 2016 10:01Last time I outlined a trading system covered by Perry Kaufman and offered some cursory critique. Today I want to cut deeper and attack the heart of his April Modern Trader article.
With this trading system, Kaufman presents a complex, multivariate set of conditions. He includes an A-period simple moving average, a B-period stochastic indicator, a C (D) stochastic entry (exit) threshold, an E (F) threshold for annualized volatility entry (exit), and a G-period annualized volatility. Kaufman has simplified the presentation by assigning values to each of these parameters and providing results for a single parameter set:
A = 100
B = 14
C = 15
D = 60
E varies by market
F = 5%
G = 20
I believe development of a trading system is an optimization exercise. Optimizing enables me to decrease the likelihood that any acceptable results are fluke by identifying plateau regions greater than a threshold level for my dependent variable (or “subjective function“). Optimization involves searching the parameter space, which by definition cannot mean selecting just one value and testing it. This is what Kaufman has done and herein lies my principal critique.
Kaufman should have defined ranges of parameter values and tested combinations. Maybe he defines A from 50-150 by increments of five (i.e. 50, 55…145, 150), B from 8-20 by increments of two (i.e. 8, 10… 18, 20), etc. The number of total tests to run is the product of the number of possible values for each parameter. If A and B were the only parameters of the trading system then he would have 21 * 7 = 147 runs in this example. The results could be plotted.
Here is what I don’t want to see:
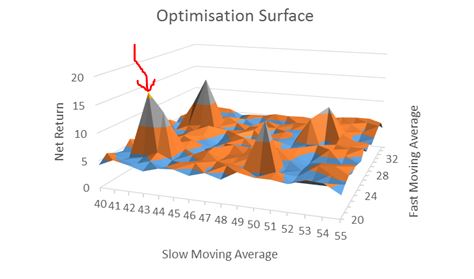
[I found this on the internet so please assume the floor to be some inadequate performance number (e.g. negative)]
A robust trading system would not perform well at particular parameter values but perform poorly with those values slightly changed. This describes a spike area as shown by the red arrow: a chance, or fluke occurrence.
Kaufman claims to have “broad profits” with his system but I cannot possibly know whether his parameter set corresponds to a spike or plateau region because he did not test any others. No matter how impressive it seems, I would never gamble on a spike region with real money. Graphically, I want to see a flat, extensive region that exceeds my performance requirements. To give myself the largest margin of safety I would then select parameter values in the middle of that plateau even if the values I choose do not correspond to the absolute best performance.
Categories: System Development | Comments (1) | Permalink