2016 Performance Update
Posted by Mark on March 16, 2017 at 07:10 | Last modified: October 13, 2017 11:04I am very past due for a performance update.
I will focus discussion on the following table:
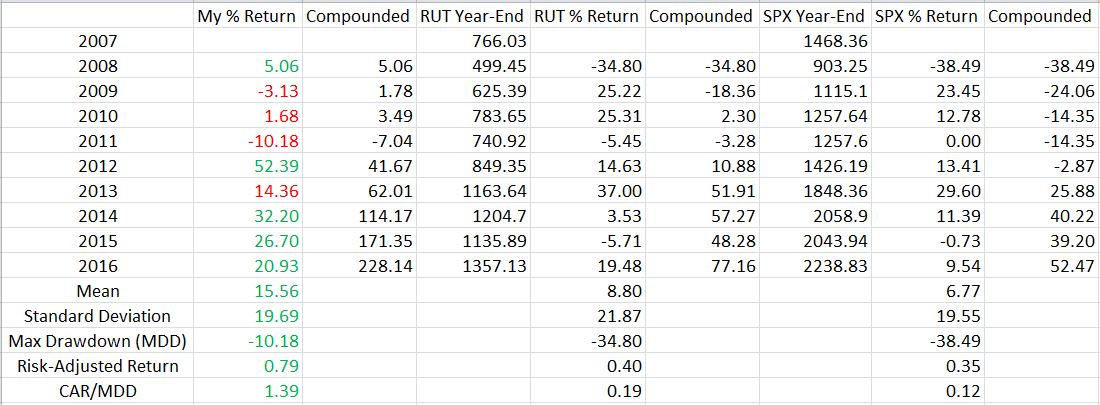
My first full-time year was 2008, which means I now have nine years of trading history. Through that time I have tried a few different things, backtested a lot, and learned tons. Hopefully I have learned most from my mistakes. Only the future can reveal whether that is true.
The table includes three sets of data. I start with my yearly performance and the compounded total return. I then repeated these calculations for the small-cap and large-cap indices. Green (red) numbers indicate where I outperformed (underperformed) the benchmark. Standard deviation is a measure of risk (as discussed here and here) along with max drawdown (MDD) (as discussed here). Risk-adjusted return is total return divided by standard deviation. CAR is compound annualized return, which makes CAR/MDD another risk-adjusted metric.
I have outperformed the benchmark in five out of nine years.
I have generated profit in seven out of nine years.
My average return significantly outpaces the indices. Mostly for that reason, the risk-adjusted returns are much better too.
My biggest disappointment is the relatively high standard deviation. To this end, my 2012 return of +52.39% hurts. I can’t say exactly what was going on with my trading that year without looking back and scrutinizing the records. Yes it’s a great number but my preference would be to have stable returns like I have the last few years.
I very much like the fact that my worst year was limited to just over a 10% loss. This is the kind of stability somewhat lacking to the upside. I experienced three catastrophic losses over the last nine years and the overall performance suggests I have bounced back quite well.
Graphically, the comparison looks like this:
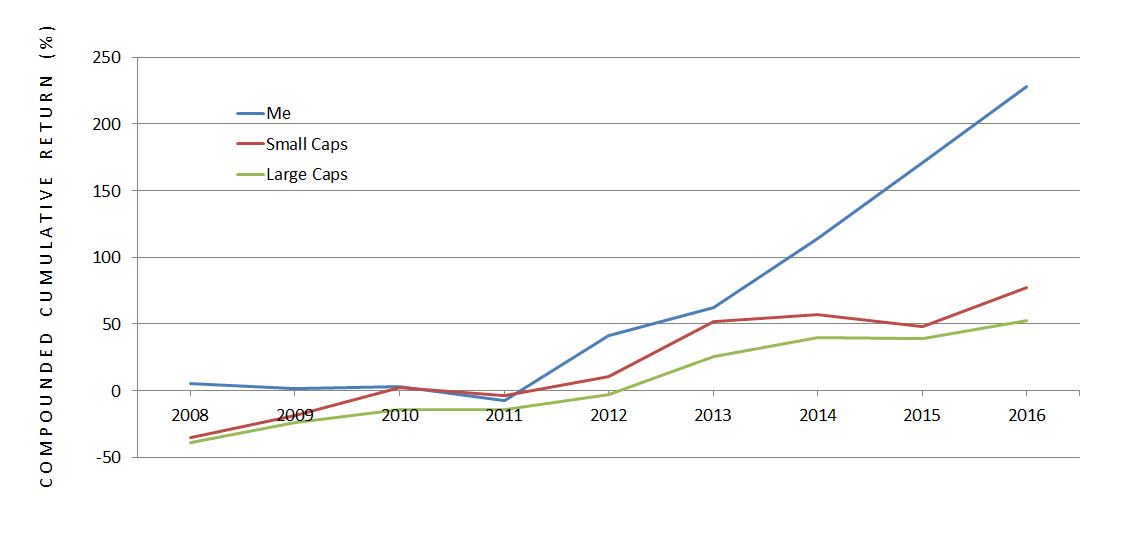
The outperformance is clear.
Although I was in negative territory and underperforming after four years, my preference is to have a relatively flat equity curve in volatile markets as opposed to a curve more jagged than the coastline of Buzzards Bay, MA. This is something I have managed to accomplish thus far.
Categories: About Me | Comments (1) | PermalinkOn the Need for Improved Financial Literacy
Posted by Mark on March 13, 2017 at 05:54 | Last modified: September 20, 2017 10:49The need for improved financial literacy nationwide is conventional wisdom: a simple internet search will bear that out. I challenged this in my last post because people seem to have little interest.
Although I criticized this challenge based on limited sample size, it may have some merit. People are generally uneducated about investing and they seem quite willing to let professionals do the job for them. In terms of value, financial literacy differs from functional literacy. Many people who cannot read or write have felt the squeeze over their lifetime from those around them including prospective employers. Hiring financial advisers is much more socially acceptable than functional illiterates asking others to read/write for them.
This pertains to a blog post I wrote in January where I decided it wasn’t the result of a brainwashing perpetrated on the American public by the financial industry. Rather, the decision to hire investment advisers is a delegation of duty. The cost of this delegation includes management fees and lower investment returns.
We could ask whether the real issue regards a need for improved financial literacy or a choice about how people wish to invest. I don’t think the average person has enough education to decide on the latter so perhaps it does come back to financial literacy. I could also argue that most financial professionals don’t know as evidenced by the fact that so many of them do not employ options.
In the last post I pointed out that trader education is a subset of financial literacy. One can know a lot about finance, understand the role of investment advisers, and know how to interview/select a knowledgeable adviser. Even someone educated in finance may elect not to take that next step and manage his/her own investments.
I think the basics of financial literacy aim to keep people out of a “paycheck-to-paycheck” struggle. This involves how debt works, proper budgeting, savings/interest, etc. Investment management pertains to savings above and beyond that needed for annual living expenses. Getting a large proportion of the working class to establish and maintain a rainy day fund would represent a significant move higher in terms of financial standing. Having surplus capital available for trading and investing, though, is still a whole other level.
For those in possession of surplus investment capital, financial literacy may be channeled into a business. This is what I have done in order to retire from Corporate America. The pharmacist in me would point out a similarity to the way some have turned “medical literacy” about dietary supplements into a business. Despite having no customers, I would argue that my product is supported by data whereas many claims regarding dietary supplements are baseless and invalid.
Categories: About Me | Comments (0) | PermalinkGiving Back (Part 3)
Posted by Mark on March 10, 2017 at 07:41 | Last modified: December 20, 2016 11:35Before continuing forward, I want to clean up a couple things—the first being the need versus achievement debate. I’m not really in a position to assess achievement. You could also make the case that I’m not really in a position to assess need. I therefore will not be deciding whom to teach based on those criteria.
I have discussed two monetary factors with regard to a trader education program. I have the previously stated reasons for charging a per-session fee. I would also recommend having ample savings to eventually open a real account. Both of these are included to try and prevent students from dropping out, which would result in time wasted for me [preparation of presentation material] and for them [education never applied].
I have thought about giving back by taking an entirely different avenue: teaching high school students. Kids are generally means-challenged so I would not charge a per-session fee. Neither are they likely capable of opening live trading accounts. They do have a solid potential for future income, however, which is wealth they could later manage on their own. Because option pricing models and considerations of probability and statistics all fall under the “advanced/theoretical mathematics” category, I would target advanced math students. This would also get me academically-disciplined students to work with who would be more likely to complete the program.
On a totally different note, I was tempted to argue against the “improve financial literacy” battle cry because people simply did not seem interested based on my recent exercise of getting 11 responses from 54 messages sent. Cost could have been a confounding variable; people may have been unwilling to pay a stranger. I also have no way of knowing how many of my 54 messages were actually received. Over the years, I have gotten poor response rates over the Meetup.com website. For all I know, only 11 people were even aware they received a message.
I do have other reasons for thinking people may not have much interest in learning to trade. Over the years I have approached a few different libraries about conducting a trader/investor program. This was met with lukewarm response because they had not found investing programs to be well-attended in the past. This was the same reason the Ann Arbor District Library gave for discontinuing their subscription to Value Line a few years ago.
Learning to trade, though, is only one subset of financial literacy. I cannot conclude from this that people have little interest in the latter.
Categories: About Me | Comments (1) | PermalinkGiving Back (Part 2)
Posted by Mark on March 7, 2017 at 06:14 | Last modified: December 16, 2016 15:54The current topic under debate is whether I should give back by trying to teach those without the resources to pay or those who have demonstrated achievement.
I think a significant discount qualifies as “giving back” even if it is not free. I thought about charging per meeting as motivation to stick with the program (it’s harder to abort once we have begun to commit). $20 per monthly meeting would be $240 for a year, which is far less than programs costing thousands of dollars. I would also encourage people in the group to study and practice (paper trade) together. Anytime they have questions I would be happy to answer. This would be a dynamite training package for a steal of a deal.
I am quite convinced that no matter how small, participants must have some skin in the game. I can’t force them to trade and I don’t want to do anything that might put me in an “investment advisor” role because I am not a registered investment advisor. A per-meeting fee helps them—by providing motivation to get through—and it helps me by lowering the probability of dropout. I would be extremely disappointed if I were to compose presentations only to later be deserted by my audience.
People who cannot afford a nominal fee face an additional problem. One must have savings in order to trade. I would probably suggest opening at least a $10,000 account to learn. I would expect interest to wane for someone unable to open a real account. Discouragement would build when trader education could not be converted into actual profits.
This is strike two against giving back to those without means. First, no fee means no front-loaded motivation to get through the course. Second, no savings means no application for the education itself.
I recently messaged people from Meetup asking if they would be interested in a trader education group. I suggested monthly meetings with a charge of up to $20 per meeting to cover expenses and to establish some accountability. From 54 messages sent, two said they would be interested, one person was a definite maybe, and eight declined.
Of the eight who declined, two said they wouldn’t pay $20 per meeting. This could also be a reason more people did not respond. While it may be healthy skepticism toward a stranger, I doubt anybody could find a complete curriculum delivered by a full-time trader for less. And what they don’t know they don’t know is that offering this for free would be doing them a greater disservice.
Categories: About Me | Comments (1) | PermalinkGiving Back (Part 1)
Posted by Mark on March 2, 2017 at 06:59 | Last modified: September 21, 2018 07:00Over the years I have found little interest among people in learning to trade options. I am thankful for what success I have had with my trading and for the freedom my entrepreneurial trading business affords me. I have given significant thought to how I might be able to “give back” as an expression of my gratitude.
I want to begin by addressing a potential contradiction between giving back, which implies free, and teaching people to undertake a for-profit enterprise. As an inextricable component of the tremendous business opportunity I have cultivated for over nine years, I believe trader education is extremely valuable. Maybe this is not something to be given for free lest its value be undercut. With the domain being strictly financial, an upfront investment seems more fitting with the goal of consistent profit over time. No investment is free and therein lies the contradiction.
I perceive a significant difference in subject matter between offering people what is essentially business training (trader education) and volunteering to tutor after school kids. I also believe the story would be different if the trader education were used to generate profits for charity.
Perhaps academic scholarship can help determine whether trader education should be free or for sale. Scholarships are generally awarded based on need or merit (i.e. achievement). The latter often includes people who would not otherwise qualify based on need. If I want to give back, should I teach financially-challenged or high-achieving individuals?
I believe consumers of expensive trader education services are more likely to stick with the program than those without obligation. I have previously discussed how traders can be a very fickle lot (myself occasionally included). Over the years I have seen people come and go through various Meetups and trading groups. This stands in stark contrast to many students I have seen motivated to complete programs for which they paid a hefty bill up front.
With many trader education programs costing thousands of dollars, people who attend are generally not those in need.
To whom should I “give back?” Score one point for merit-based because those with nothing to pay are lacking a key motivator to get through.
I will continue next time.
Categories: About Me | Comments (3) | PermalinkThe Risk of Going Naked (Part 2)
Posted by Mark on February 27, 2017 at 07:26 | Last modified: December 22, 2016 11:23I recently presented some excerpts from an online forum regarding the risk of trading naked options.
This is the kind of sobering talk that makes me uncomfortable with leverage. Regardless of the extent to which market turmoil occurred in the backtesting period, a severe enough market crash could always bring to fruition something worse.
Without leverage, drawdowns tend to be minimal, risk of Ruin is relatively small, and quality of sleep is restful throughout. While I am tempted to take advantage by boosting position size for better total return while maintaining equal or lesser drawdowns, doing so means adding leverage right back into the equation.
If I want to hedge myself against the most extreme moves then I can buy [cheap] insurance. This will increase return on capital. This will also save me if the catastrophic market crash actually takes place, which has anecdotally happened every 5-7 years throughout the current century. The market will more commonly fall several percentage points and level off or reverse higher. This magnitude of correction is nowhere near that required to realize max loss on the hedged naked puts (vertical spreads). The breakeven point would require an even larger drop since the insurance is not free.
And while that max loss is much lower than the “undefined risk” of naked puts, the loss is probably catastrophic either way. I’m tempted to backtest this and look at different position sizing but the sample size would be too small to allow for any meaningful conclusions.
I think it would be nice to insure the extremes and be able to claim “were the market ever to crash to zero, you would be covered [or even profit].” A total market crash is what doomsday forecasters love to prognosticate. Hedging against this is always possible with options but it comes at the cost of lower profitability during normal market action. My preferred solution is to allocate no more than X% of one’s total portfolio to this sort of “unlimited risk” trading.
Allowing for the possibility of catastrophic loss and managing risk by position sizing is, in my mind, what has relegated a strategy like this to accredited investors and hedge funds.
Then again, this argument could be easily contested. Common stocks—purchasable with leverage to investors who are not accredited—also go to zero (e.g. bankruptcy). While baskets of stocks rarely go to zero and indices have never gone to zero, all of the above have suffered catastrophic losses: pick any stock market crash. Limiting total portfolio allocation, therefore, is probably smart whether dealing with naked puts or long stock.
In the eyes of the regulators, naked puts would probably be okay for anyone as long as position sizing is based on Reg T margin requirements (i.e. cash-secured).
Categories: Option Trading | Comments (0) | PermalinkFooled by Randomness
Posted by Mark on February 24, 2017 at 07:06 | Last modified: November 8, 2016 15:09William Bernstein, co-founder of Efficient Frontier Advisors and author of several books, was interviewed in the September 2016 issue of the AAII Journal. He made an interesting point that reminded me of Nassim Taleb’s book Fooled by Randomness:
> …never confuse outcome with process. By that
> I mean that there is a lot of noise in investing,
> and it is perfectly possible to have a bad
> strategy or be a stupid investor… and do very
> well. People who buy lottery tickets occasionally
> win. Having a good strategy and not having a good
> result happens all too frequently as well. The
> essential thing people really don’t understand
> about finance is that there is an enormous
> amount of noise, particularly over the short term.
The take-home message for me is the first line: never confuse outcome with process. The stock market goes up most of the time. It may even go up for years. When it corrects, large sums of money can be lost in short periods of time. One must be careful not to lose all that has been gained or more.
While the market is going up, people are happy with their strategies and impressed with themselves. Many think they have skills and have attained a level of expertise. Remember the old saying “a rising tide lifts all boats,” though, which suggests most stocks rally when the market moves higher. Anyone participating during these bull market periods is likely to make money regardless of strategy. Ego can really come into play when people dramatically increase position size. This inconveniently happens all too often just in time for the next market correction or crash.
Trading system development methodology is designed to determine whether a profitable system is attributable to an effective strategy or simply a matter of luck. The process is designed to screen out the luck factor by studying large sample sizes, maximum drawdowns, employing Monte Carlo simulation, and walk-forward analysis. This is challenging work because it requires coding skills and software know-how in addition to theoretical understanding.
The cost of mistaking random luck for skill worthy of confidence is an increased likelihood of catastrophic loss when the next bear market rears its ugly head: something none of us look forward to.
Categories: Wisdom | Comments (0) | PermalinkThe Risk of Going Naked (Part 1)
Posted by Mark on February 21, 2017 at 06:35 | Last modified: December 14, 2016 16:13Today I want to step back and review the risk of trading naked options.
The following exchange occurred in a Yahoo! Group I followed back in May 2015. R started it out:
> I think anyone selling options should read
> The Black Swan by Nassim Taleb to understand
> low probability, high impact events. This is
> the risk with leveraged naked option selling.
> To give an extreme example, nobody in their
> right mind plays Russian Roulette with a gun that
> has a barrel with 99 empty chambers and just
> one bullet. Even though you are “correct” 99% of
> the time, when you are wrong it’s game over.
V wrote:
> I was in no way doubting your numbers. I just
> wanted to know if you were writing closer or
> using more margin or different underlyings.
> I apologize for the misunderstanding.
V also wrote:
> It’s all good. I appreciate the openness of
> the group and the desire to educate and
> enlighten everyone. The returns are beating
> all hedge funds, which is amazing to me. I
> hope I didn’t come off as skeptical.
I responded:
> You should be skeptical, V. Recent posts by R
> about naked option selling raise an extremely
> good point and very scary possibility for those
> trying to make a living by doing this. The other
> side of the coin is that this work should not
> simply be dismissed because it’s naked option
> selling. There’s plenty of reason to think that
> it can work given particular management
> techniques and strategies: much of which are
> discussed in this group.
>
> Another reason to be skeptical is that even
> people who report solid returns are sometimes
> “under the influence.” They may never have
> seen significant downside and may be ignorant
> as to how positions are affected when volatility
> truly explodes. People might report returns
> accurately but, as R noted, if those returns are
> annualized and we have a 2 SD downmove a
> couple months later then those annualized
> returns will never be realized.
>
> Whenever people start talking or writing as if
> anything in trading is a sure thing or an ATM
> machine, I become suspicious. I believe that’s
> when you should start asking what they’re
> missing or where they are wrong. If you
> can’t find anything then maybe they are truly
> onto something.
I will continue next time.
Categories: Option Trading | Comments (1) | PermalinkDynamic Iron Butterflies (Part 5)
Posted by Mark on February 16, 2017 at 07:28 | Last modified: February 2, 2017 09:40Better execution can definitely improve profitability of the dynamic iron butterfly (DIBF). This makes me wonder about placing the trade and just leaving it to sit until filled.
Analysis of the maximum adverse excursion (MAE) can help to study this. A losing trade could almost always have been filled at a better price. Out of 3968 backtrades, 736 never get down more money than they are at trade inception. Minute-to-minute volatility in the markets is much greater than day-to-day (seen in my EOD backtest) volatility, which provides hope that most of the 736 would eventually fill. This is no guarantee, however, and 18% includes a big opportunity for otherwise winning trades to go unfilled thereby depressing total return.
Here is the complete MAE distribution across 3,968 backtrades:
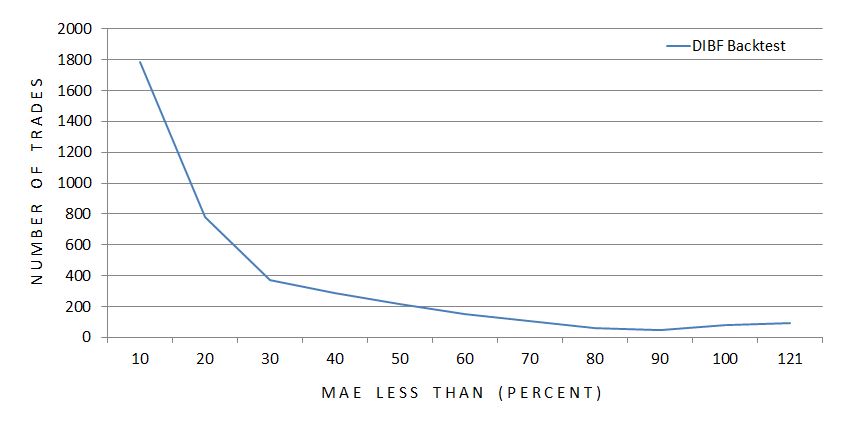
The x-axis indicates the maximum MAE seen for each particular grouping of trades. The first data point includes all trades with MAE less than 10%, the second data point includes all trades with MAE of 10% up to 20%, etc.
The graph illustrates a majority of trades never get down a whole lot.
Here’s the same information packaged somewhat differently:
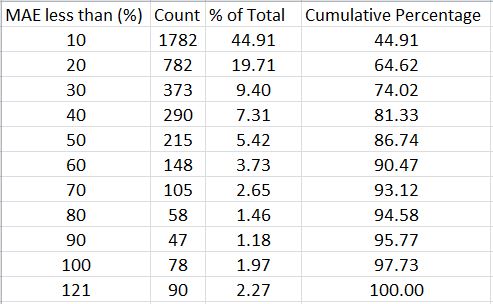
With a profit target of 10%, over 64% of all backtrades never get down more than 20% and over 86% never get down more than 50%.
This suggests a potential benefit to using a stop-loss. I still need to better understand how many winners would be affected, though. How does the MAE distribution compare between winning and losing trades?
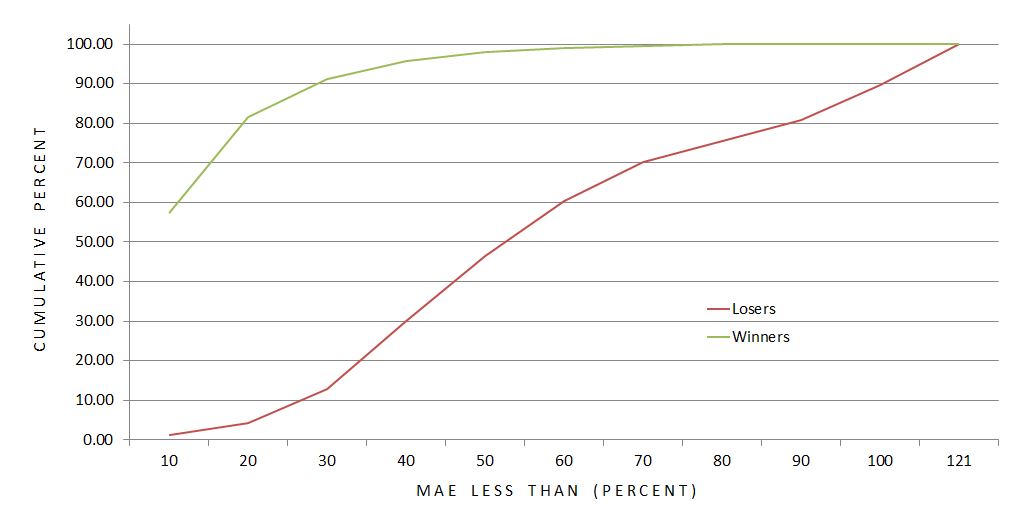
This graph shows the difference to be significant. Over 91% of winners never get down more than 30% compared to just under 13% of losers. The average MAE for winning (losing) trades is 12.9% (57.9%).
Over 98% of winning trades are never down more than 50%.
Is a 50% stop-loss worthwhile?
The cost is conversion of 59 winning trades into certain losers ranging anywhere from 50-90%.
The benefit is an opportunity to save money on 467 trades that would otherwise lose up to ~100%.
This sounds like a reasonable trade-off to me since the number of trades potentially benefitting is eight times the number to suffer a worse fate. And even if the overall return does not improve, cutting down the biggest losers would still reduce the standard deviation of returns, which is a measure of risk.
Confirming this would involve collecting revised loss data on 526 backtrades with MAE over 50%. I should also backtest the surrounding parameter space by checking stop-loss thresholds like 10%, 20%, etc. This could be an awful lot of work…
But who ever said making a business out of trading should ever be easy?
Categories: Backtesting | Comments (1) | Permalink